Fig. 4

Download original image
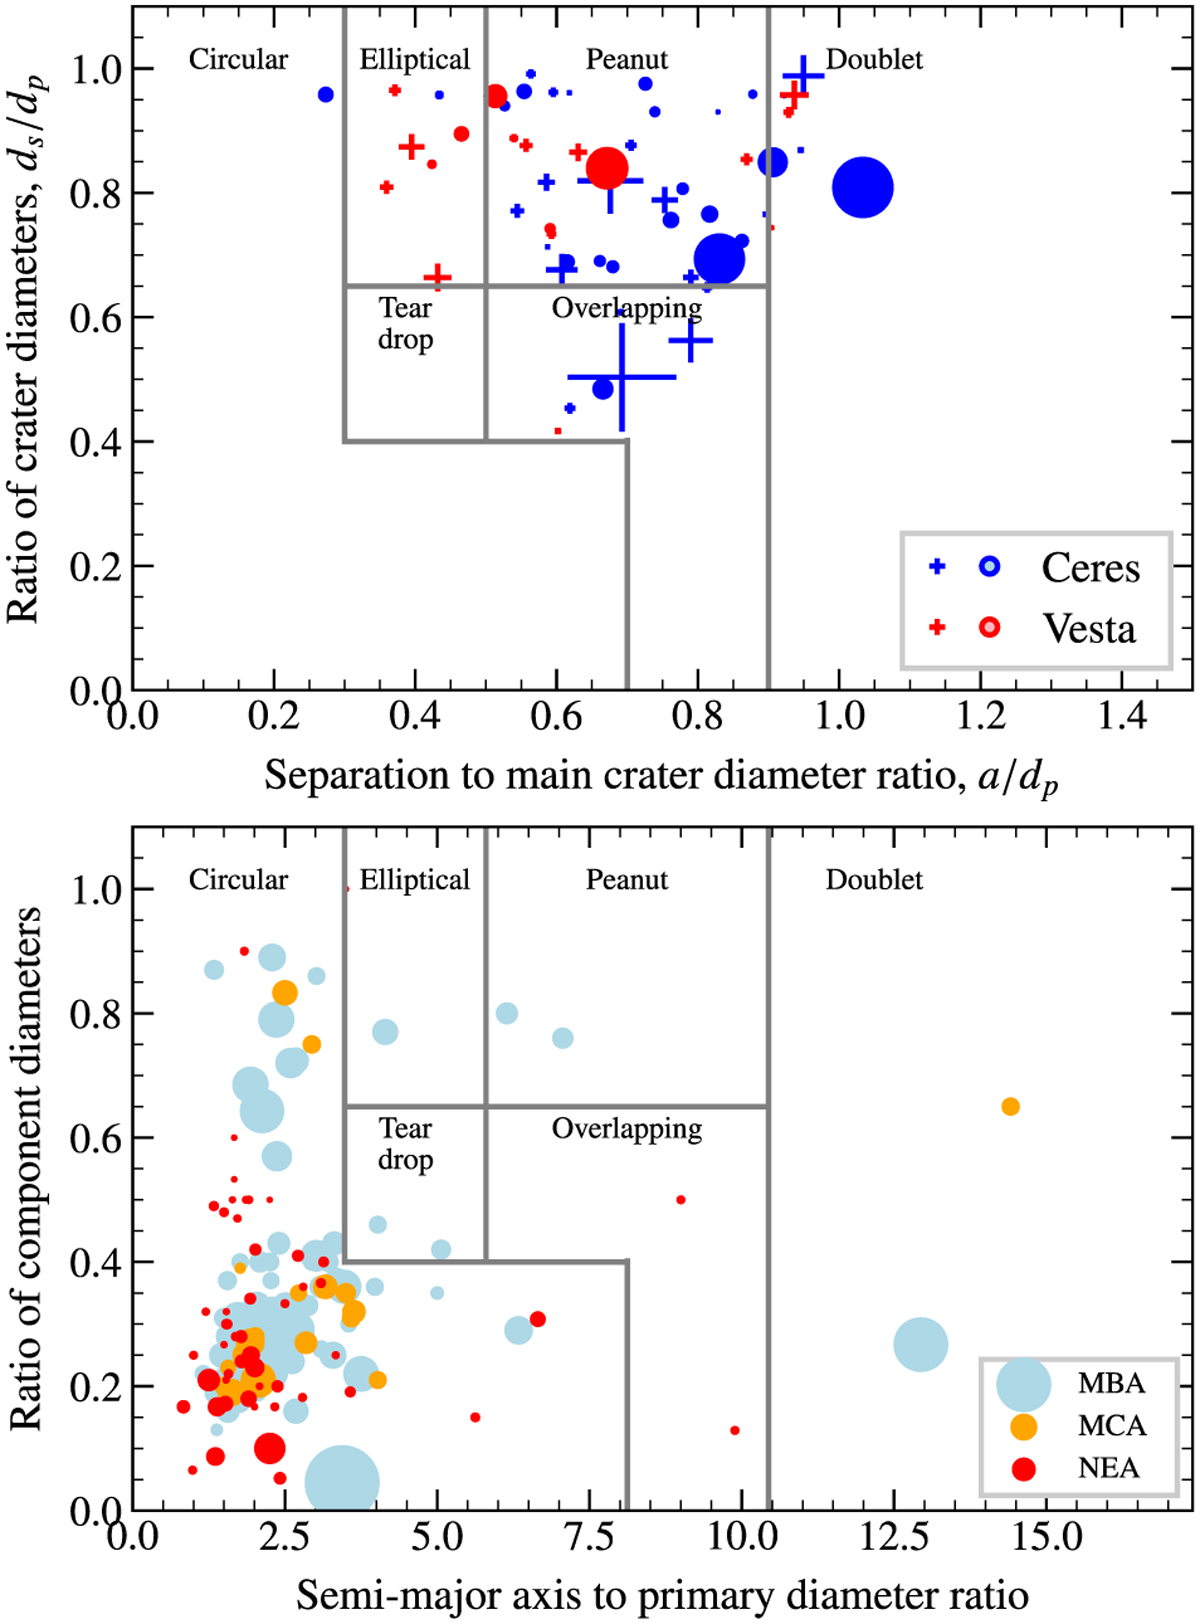
Comparison between the population of binary craters (top) associated with the impact of binary asteroids, and the observed population of binary asteroids (bottom). Top: distribution of the craters in terms of the separation–size ratio space for Ceres (blue) and Vesta (red). Crosses represent likely binary craters while the circles are the very likely binary craters (see Sec. 3). Symbol size is indicative of the primary crater diameter. We note that the absence of data in the left part of the graph is a consequence of the limitation of our survey and likely does not represent the absence of binary craters close to each other. Bottom: distribution of binary asteroids in semimajor axis/size ratio space, color-coded according to their orbital characteristics: MBAs in light blue, MCAs in yellow, and NEAs in red. The morphological crater classification defined by Miljković et al. (2013) is added in both plots as a guideline.
Current usage metrics show cumulative count of Article Views (full-text article views including HTML views, PDF and ePub downloads, according to the available data) and Abstracts Views on Vision4Press platform.
Data correspond to usage on the plateform after 2015. The current usage metrics is available 48-96 hours after online publication and is updated daily on week days.
Initial download of the metrics may take a while.


