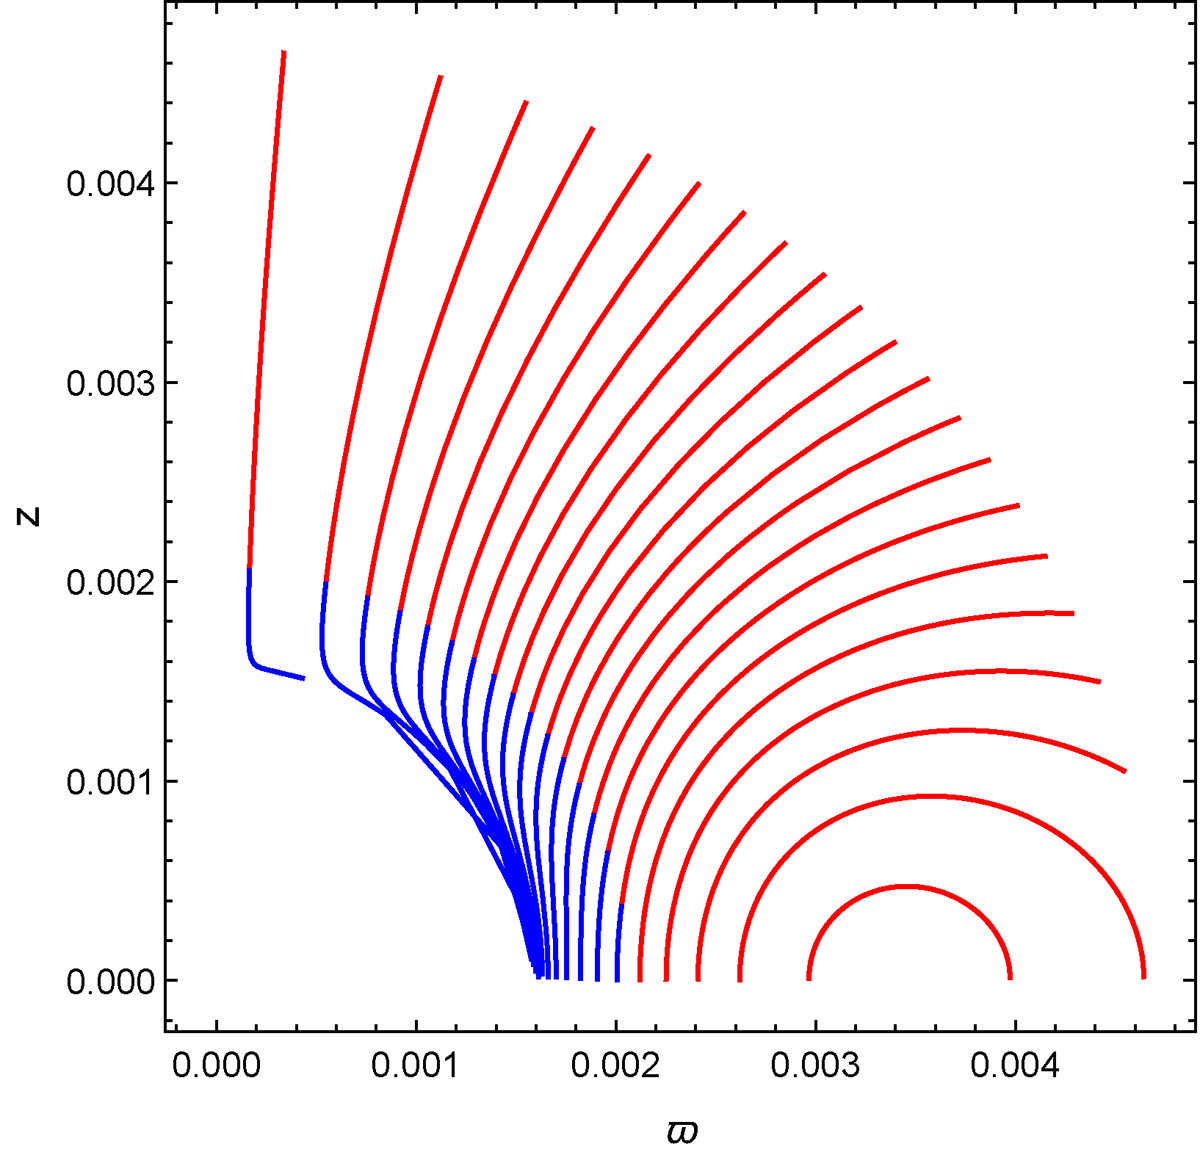
Fig. 8.
Download original image
Field lines close to the stagnation surface. The lines are over-collimated at the beginning, which is in agreement with the high value of the toroidal magnetic field. All the distances are on a scale of a thousand Schwarzschild radii (1000 rs). Blue lines refer to the flow before the critical point, whereas the red ones refer to after it has crossed the critical point. ![]() and
and ![]() .
.
Current usage metrics show cumulative count of Article Views (full-text article views including HTML views, PDF and ePub downloads, according to the available data) and Abstracts Views on Vision4Press platform.
Data correspond to usage on the plateform after 2015. The current usage metrics is available 48-96 hours after online publication and is updated daily on week days.
Initial download of the metrics may take a while.