Fig. 8
Download original image
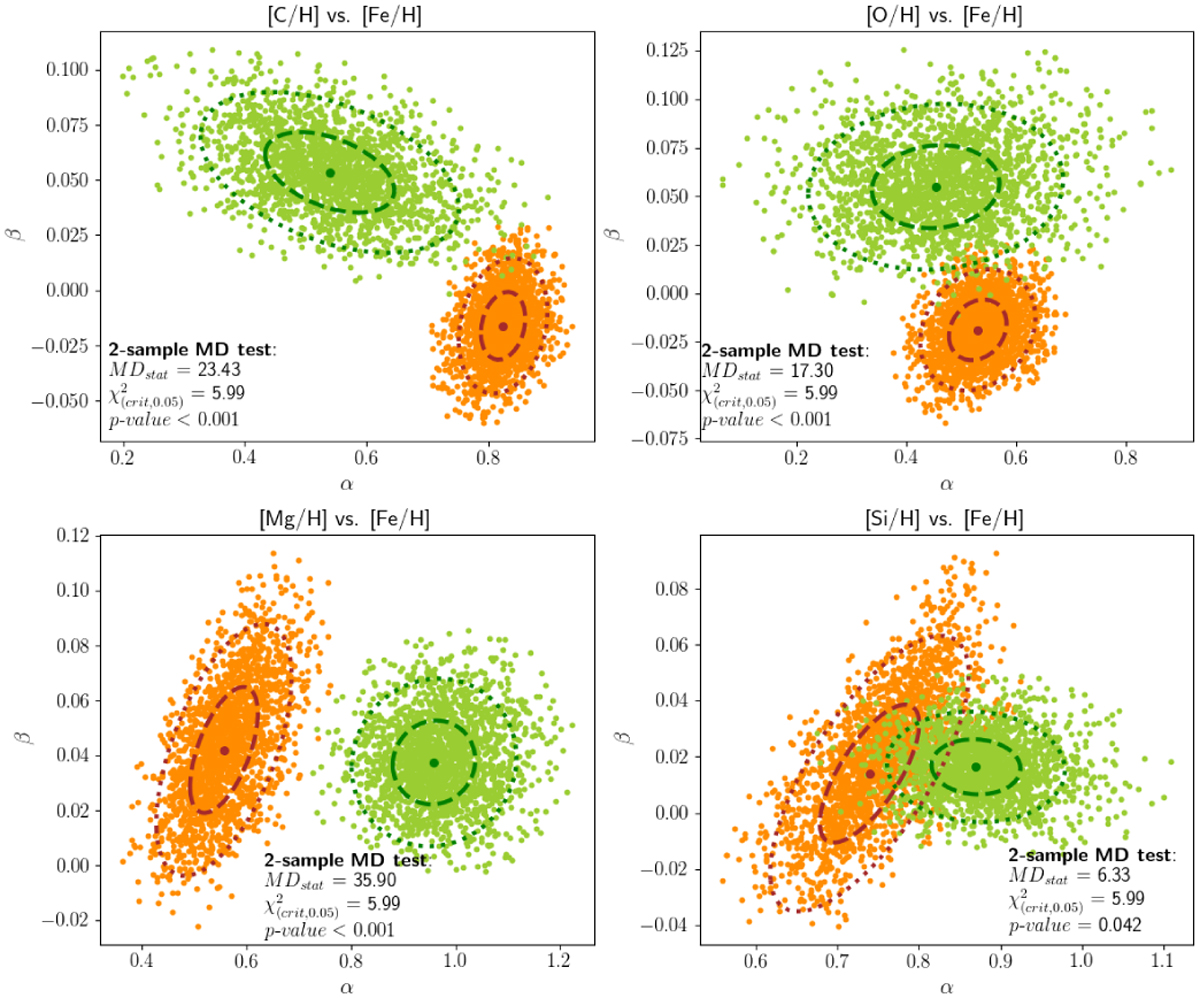
Comparison of the model coefficients (slope, α, and intercept, β) of the chemical trends between M dwarfs (orange dots) and GK dwarfs (green dots), along with the statistical test results. The dashedanddotted ellipses indicate the 1σ and 2σ contours of their best-fit values (the dots in brown and in darker green). Here, we show only the cases for C, O, Mg, and Si; the full set of comparisons of these model coefficients for all elemental pairs can be found in Fig. B.9. See text for details of the statistical test of the null hypothesis, ![]() .
.
Current usage metrics show cumulative count of Article Views (full-text article views including HTML views, PDF and ePub downloads, according to the available data) and Abstracts Views on Vision4Press platform.
Data correspond to usage on the plateform after 2015. The current usage metrics is available 48-96 hours after online publication and is updated daily on week days.
Initial download of the metrics may take a while.