Fig. 7
Download original image
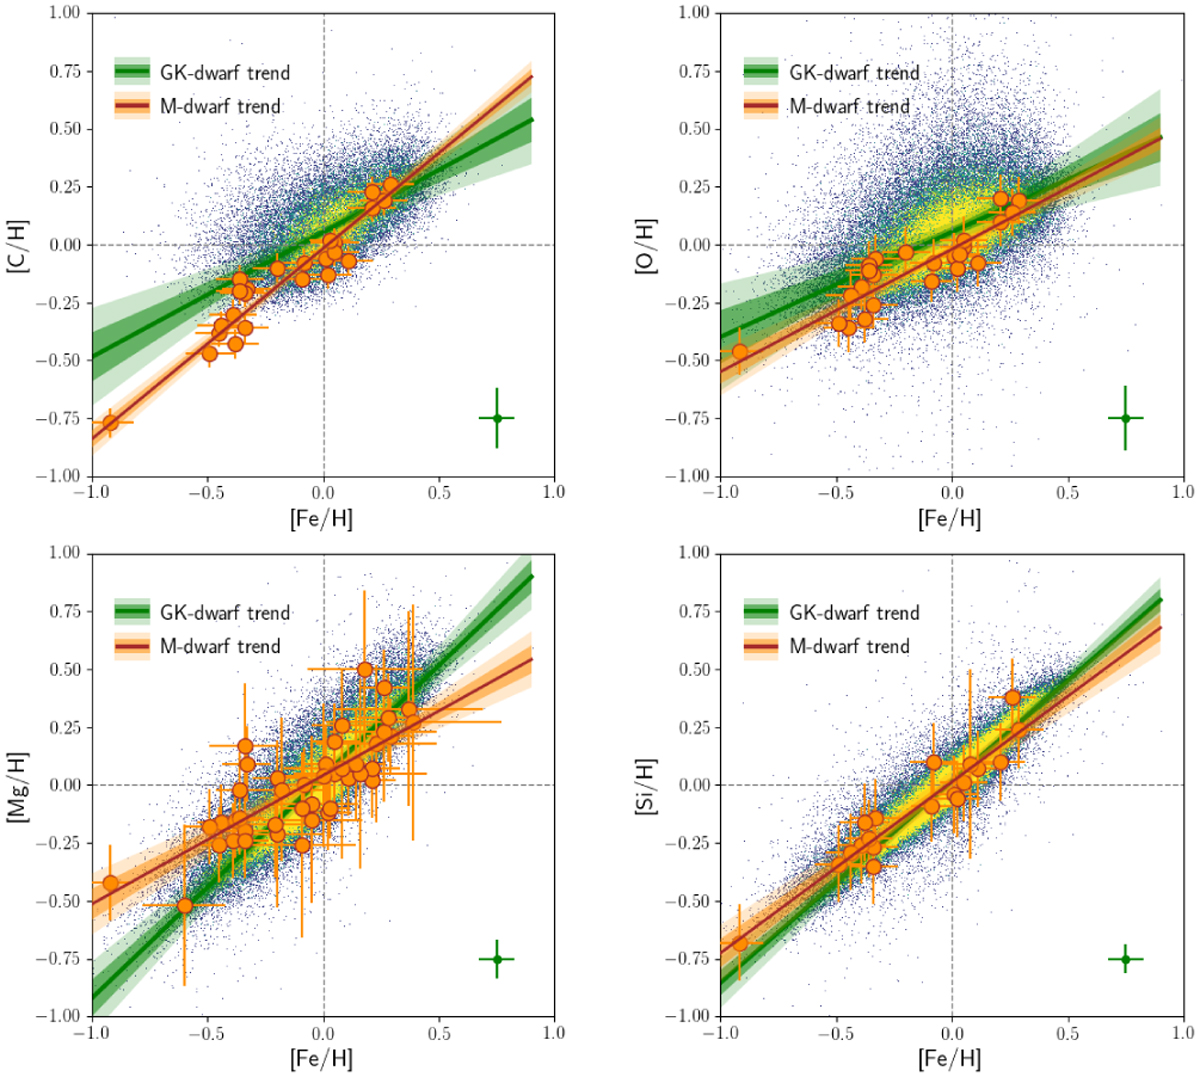
Comparison of the chemical trends of [X/H]–[Fe/H] between M dwarfs and GK dwarfs, based on Figs. 5 and 6. The underlying colourful dots in density represent the selected (original) sample of GK dwarfs, with their typical error bars shown in the lower right corner of each panel. The overlying orange dots (with error bars) represent the selected (original) sample of M dwarfs. The darker and lighter shaded wedges of individual regression lines represent their 1σ and 2σ error intervals, respectively. Here, we only show the cases for C, O, Mg, and Si; the full set of comparisons of these chemical trends for all elemental pairs can be found in Fig. B.8.
Current usage metrics show cumulative count of Article Views (full-text article views including HTML views, PDF and ePub downloads, according to the available data) and Abstracts Views on Vision4Press platform.
Data correspond to usage on the plateform after 2015. The current usage metrics is available 48-96 hours after online publication and is updated daily on week days.
Initial download of the metrics may take a while.