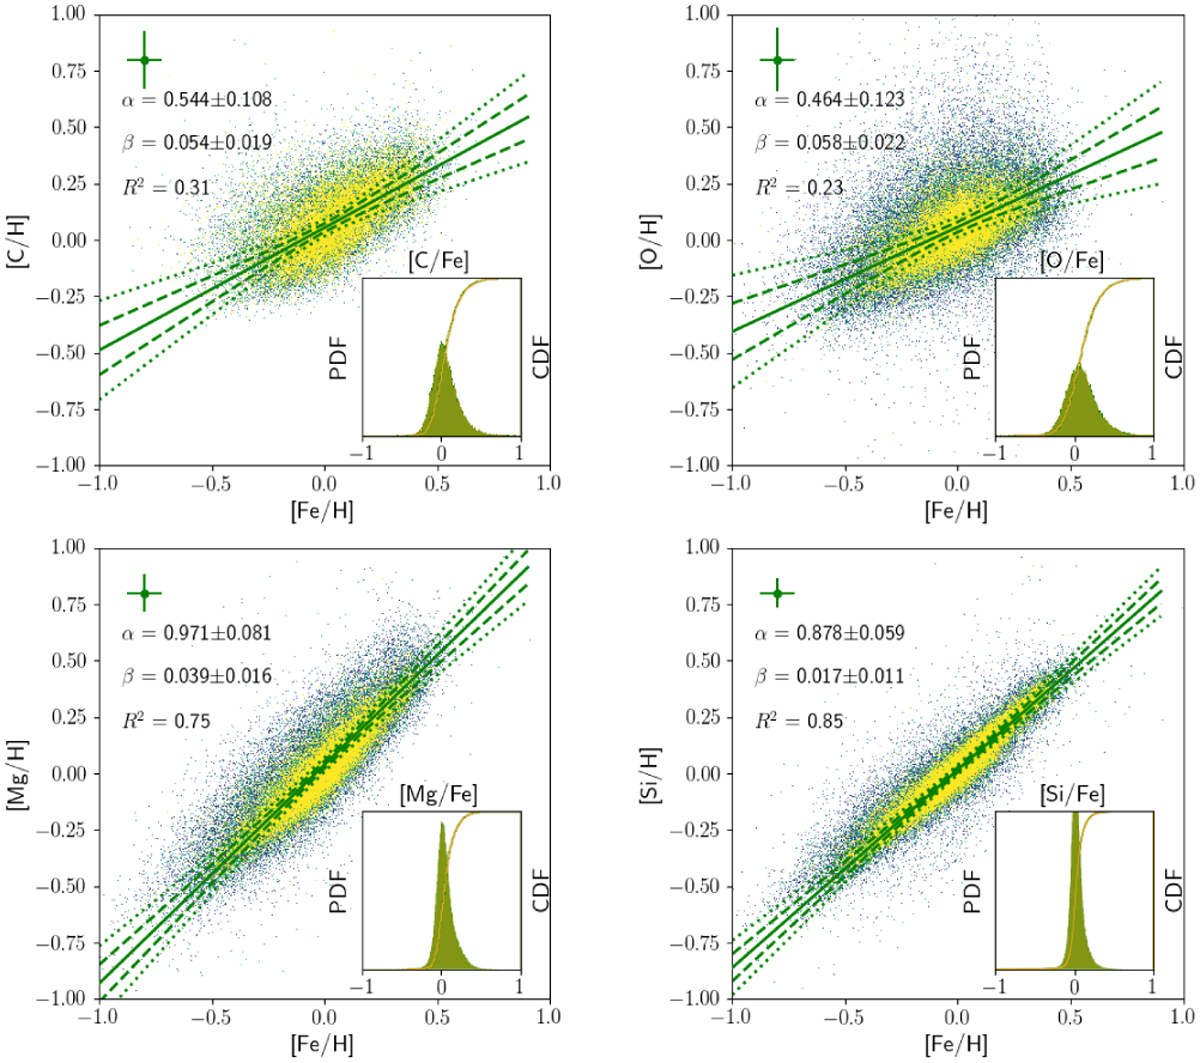
Fig. 5
Download original image
[X/H]–[Fe/H] trends of (thin-disc) GK dwarfs, found by ODRs following a resampling procedure (see text for details). The model parameters (slope, α, intercept, β, and coefficient of determination, R2) are shown in the individual panels. The underlying dot clouds are the resampled GK dwarfs (nearly 100 000 data points after removing ≲4% of outliers (Fig. B.4)). The typical error bars of the sample are shown in the upper left corner of each panel. The best fits are shown in solid lines with their 1σ and 2σ error intervals shown in dashed and dotted lines, respectively. The insets in individual panels show the probability density functions (PDFs, y-axis scale omitted) and cumulative density functions (CDFs, y-axis scale omitted) of both the selected (original) sample of GK dwarfs (in green) and the resampled GK dwarfs (in yellow), which completely overlap with each other. Here, we show only the cases for C, O, Mg, and Si; the full set of chemical trends for all elemental pairs can be found in Fig. B.5.
Current usage metrics show cumulative count of Article Views (full-text article views including HTML views, PDF and ePub downloads, according to the available data) and Abstracts Views on Vision4Press platform.
Data correspond to usage on the plateform after 2015. The current usage metrics is available 48-96 hours after online publication and is updated daily on week days.
Initial download of the metrics may take a while.