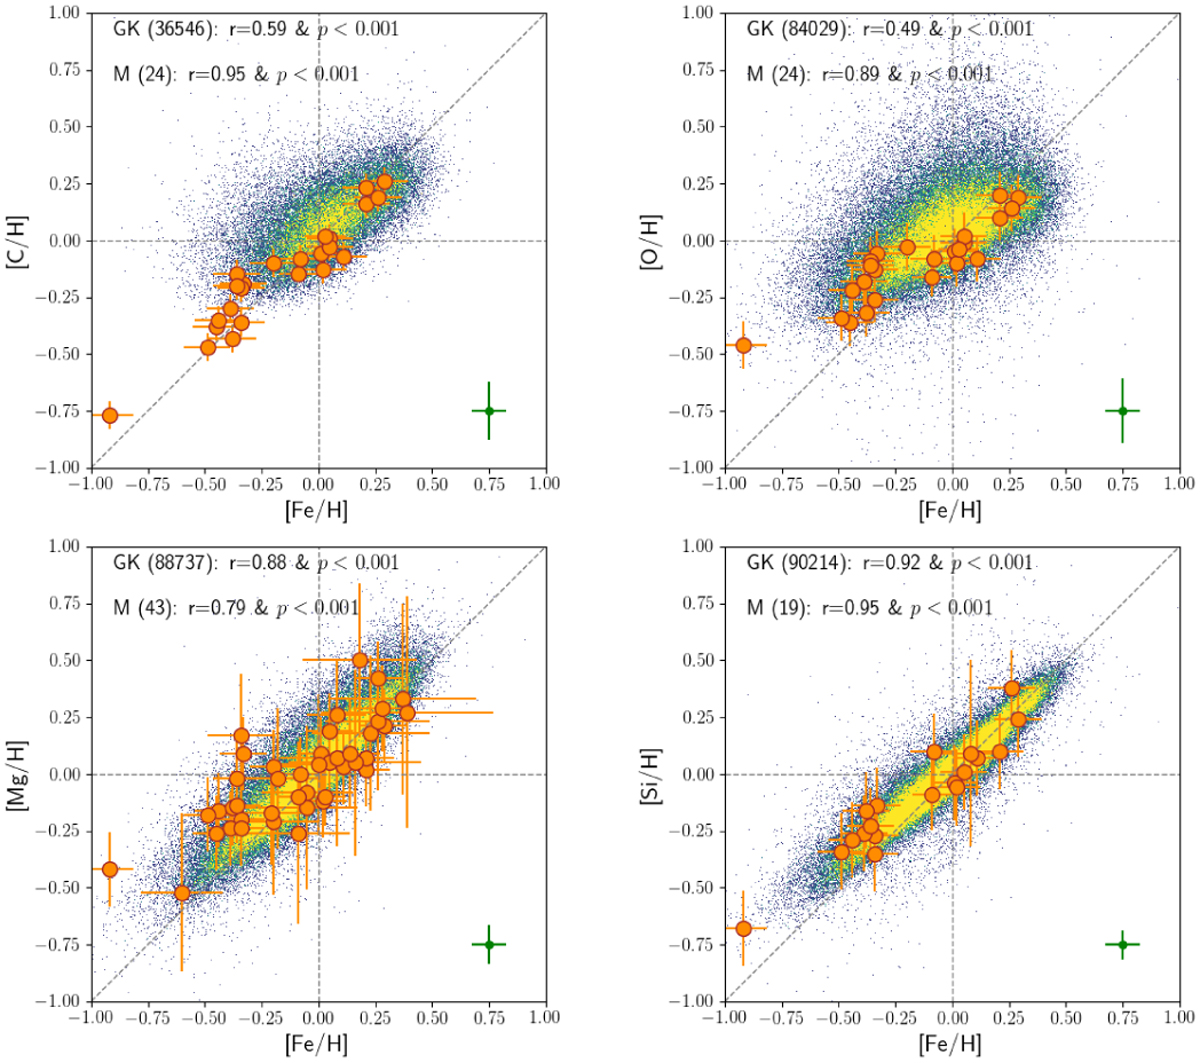
Fig. 4
Download original image
Comparison of the selected samples of (thin-disc) GK dwarfs (the density plot in the background) and M dwarfs (the overlying orange dots) in the [X/H]–[Fe/H] space. The sample sizes of GK and M dwarfs are shown in each diagram, along with the corresponding test parameters (r and p-value) of Pearson‘s linear correlation (Schober & Schwarte 2018). For reference, the typical error bars of the GK dwarf abundances ([X/H] vs. [Fe/H]) are shown in the lower right corner of each panel, and the zero point of each panel is indicated by the horizontal and vertical dashed lines, along with the diagonal line of the panel. Here, we show only the cases for C, O, Mg, and Si; the full set of comparisons for all elemental pairs can be found in Fig. B.3.
Current usage metrics show cumulative count of Article Views (full-text article views including HTML views, PDF and ePub downloads, according to the available data) and Abstracts Views on Vision4Press platform.
Data correspond to usage on the plateform after 2015. The current usage metrics is available 48-96 hours after online publication and is updated daily on week days.
Initial download of the metrics may take a while.