Fig. 2

Download original image
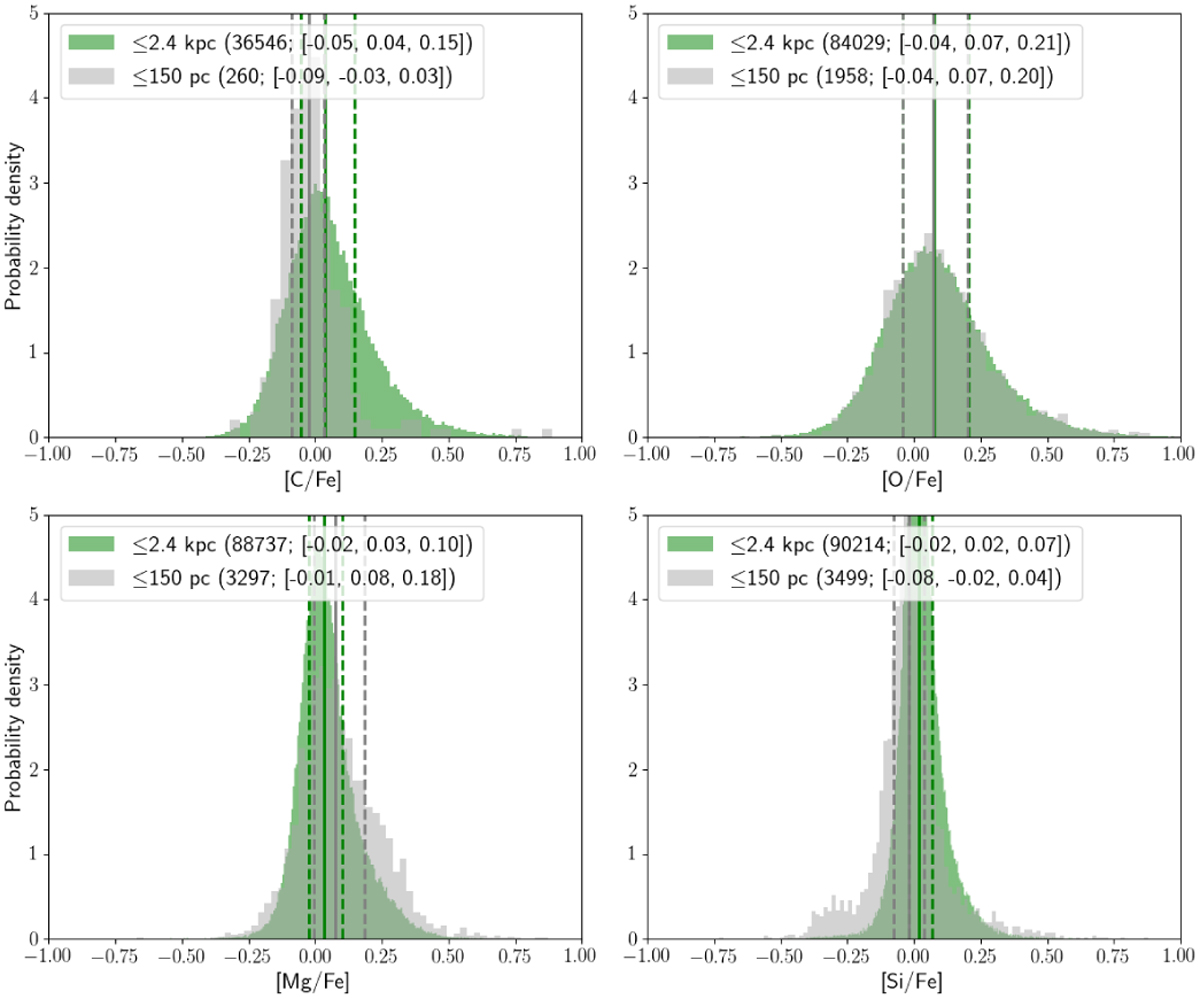
Comparison of the probability densities of [X/Fe] between the full sample of thin-disc GK dwarfs (with a distance of up to 2.4 kpc from the Sun; in green) and the smaller subset of thin-disc GK dwarfs within 150 pc (in grey) of the solar neighborhood. In the parentheses in the legend, the first value is the number of stars with valid abundances of element X, and the values within brackets correspond to [X/Fe] values at [25, 50, and 75] percentiles. Such [X/Fe] values are also indicated by solid (50 percentile) and dashed (32 and 68 percentiles) lines in green (for the full ‘≤2.4 kpc’ sample) and in grey (for the nearby ‘≤150 pc’ sample). Here, we show only the cases for C, O, Mg, and Si; the full set of comparisons for all elements can be found in Fig. B.1.
Current usage metrics show cumulative count of Article Views (full-text article views including HTML views, PDF and ePub downloads, according to the available data) and Abstracts Views on Vision4Press platform.
Data correspond to usage on the plateform after 2015. The current usage metrics is available 48-96 hours after online publication and is updated daily on week days.
Initial download of the metrics may take a while.


