Fig. B.6
Download original image
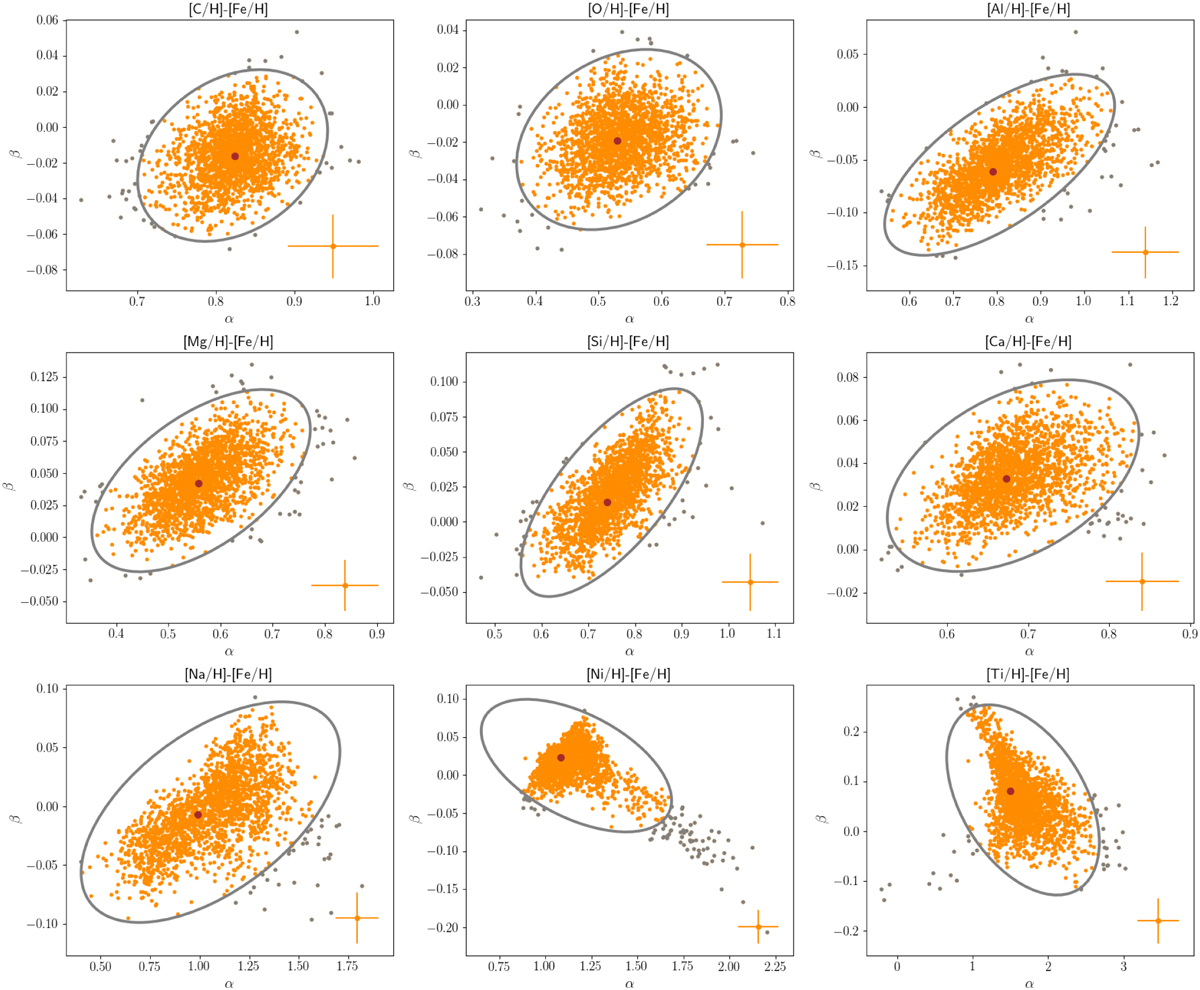
Distribution of the (raw) 2000 sets of model parameters (slope, α, and intercept, β) of M dwarfs for each pair of [X/H]–[Fe/H], following a bootstrap and regression process (see details in Sect. 3.2). The typical error bars of these individual model parameters (in orange) are indicated in the lower right corner of each panel, with the best-fit values shown in brown. The few dots in grey are the outliers identified at the 2D 3σ level (ellipses in grey) with an MD outlier identification approach (Ghorbani 2019). Those outliers account for ≲ 4% of the raw sets of model parameters and haven been removed for further analysis.
Current usage metrics show cumulative count of Article Views (full-text article views including HTML views, PDF and ePub downloads, according to the available data) and Abstracts Views on Vision4Press platform.
Data correspond to usage on the plateform after 2015. The current usage metrics is available 48-96 hours after online publication and is updated daily on week days.
Initial download of the metrics may take a while.