Fig. A.1
Download original image
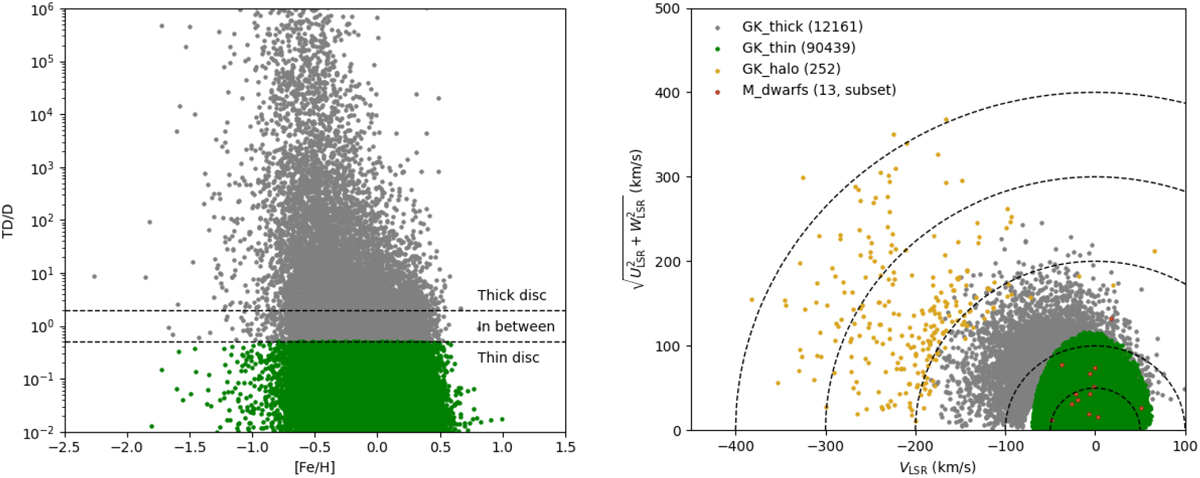
Population classification of the sample of GK dwarfs. Left: Classification of thin- and thick-disc stars based on a probability ratio (TD/D) defined in Bensby et al. (2014) (here, the “in-between” stars are grouped into “thick-disc” stars). Right: The Toomre diagram of the sample of GK dwarfs based on their kinematic data (ULSR, VLSR, and WLSR, relative to the local standard of rest (LSR); Bensby et al. 2014). The dashed curves indicate the isotropic total space velocities (vtot). A subset sample of M dwarfs with available kinematic data (Ishikawa et al. 2022) are also shown for comparison.
Current usage metrics show cumulative count of Article Views (full-text article views including HTML views, PDF and ePub downloads, according to the available data) and Abstracts Views on Vision4Press platform.
Data correspond to usage on the plateform after 2015. The current usage metrics is available 48-96 hours after online publication and is updated daily on week days.
Initial download of the metrics may take a while.