Fig. 10
Download original image
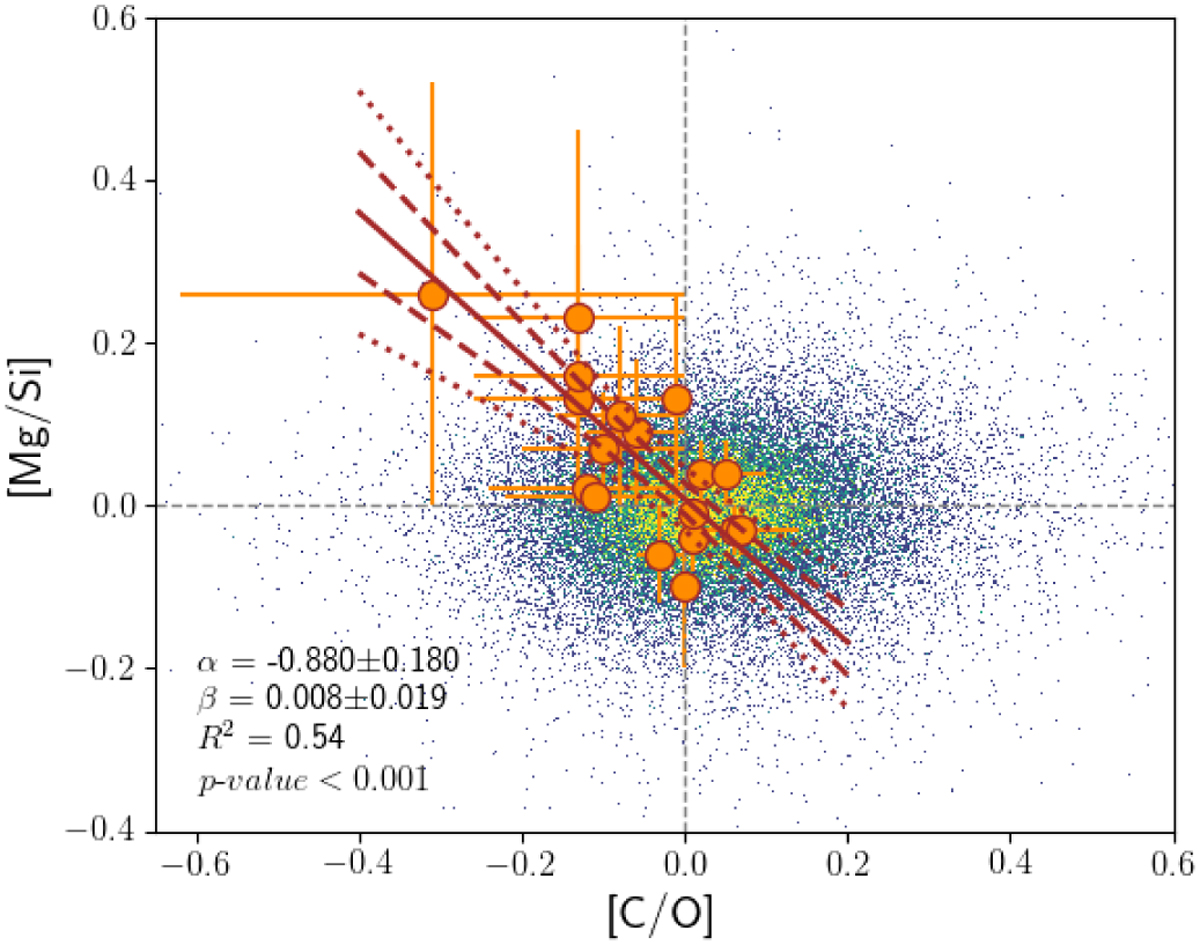
[Mg/Si]–[C/O] diagram for the M-dwarf sample (overlying orange dots) and GK dwarf sample (underlying colourful dots in density). An ODR fit was applied to the M-dwarf sample, with the best fit shown in the solid line and 1σ and 2σ error intervals shown in dashed and dotted lines (in brown), respectively. The regression parameters are also shown on the plot. A Student’s t-test was also applied to test the significance of the slope different from zero, and the resultant p-value is less than 0.001.
Current usage metrics show cumulative count of Article Views (full-text article views including HTML views, PDF and ePub downloads, according to the available data) and Abstracts Views on Vision4Press platform.
Data correspond to usage on the plateform after 2015. The current usage metrics is available 48-96 hours after online publication and is updated daily on week days.
Initial download of the metrics may take a while.