Fig. 9.
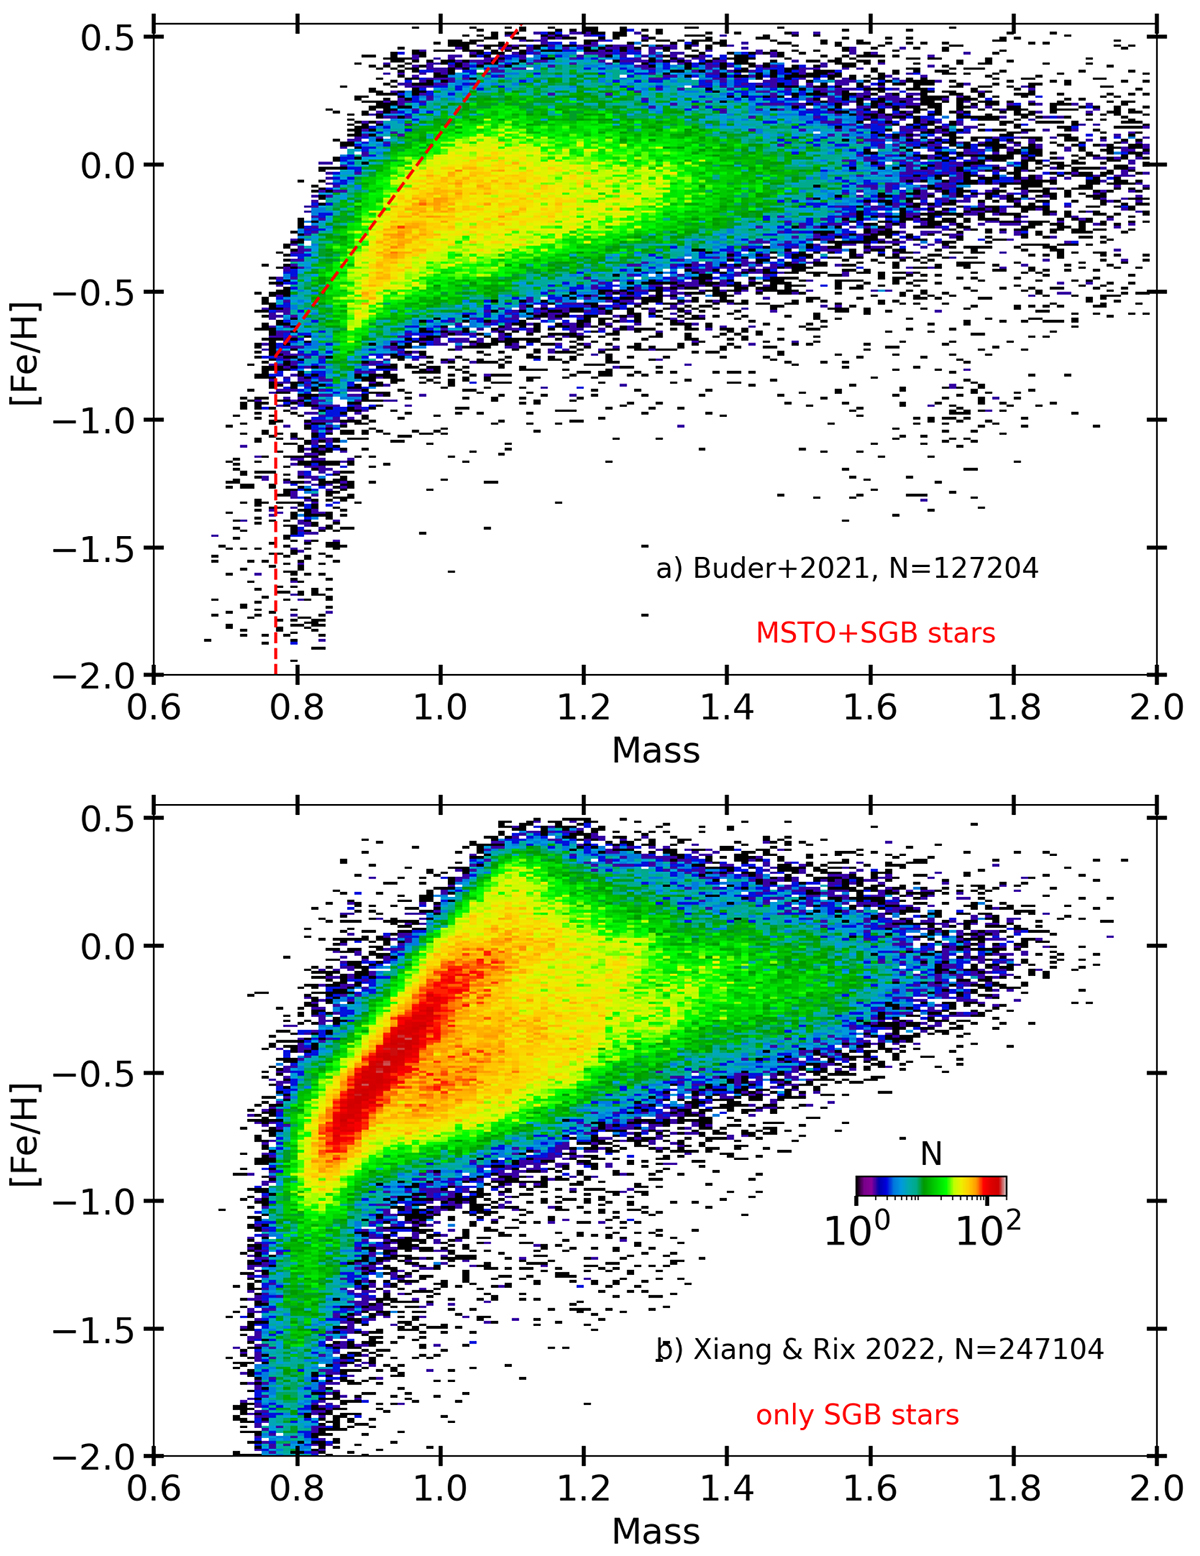
Download original image
[Fe/H] as a function of stellar mass for the GALAH DR3 stars (panel a) and the LAMOST-LRS catalogue of Xiang & Rix (2022) (panel b). The plots are colour coded according to the logarithm of number density. The GALAH DR3 sample includes stars in both MSTO and subgiant evolutionary stages, while the LAMOST sample only includes the subgiant stars. The red dashed lines plotted in panel (a) mark the visually estimated boundary from panel (b) and show that, in the case of GALAH, a significantly larger number of low-mass stars at higher metallicities (> −0.5) is included.
Current usage metrics show cumulative count of Article Views (full-text article views including HTML views, PDF and ePub downloads, according to the available data) and Abstracts Views on Vision4Press platform.
Data correspond to usage on the plateform after 2015. The current usage metrics is available 48-96 hours after online publication and is updated daily on week days.
Initial download of the metrics may take a while.