Fig. 7.
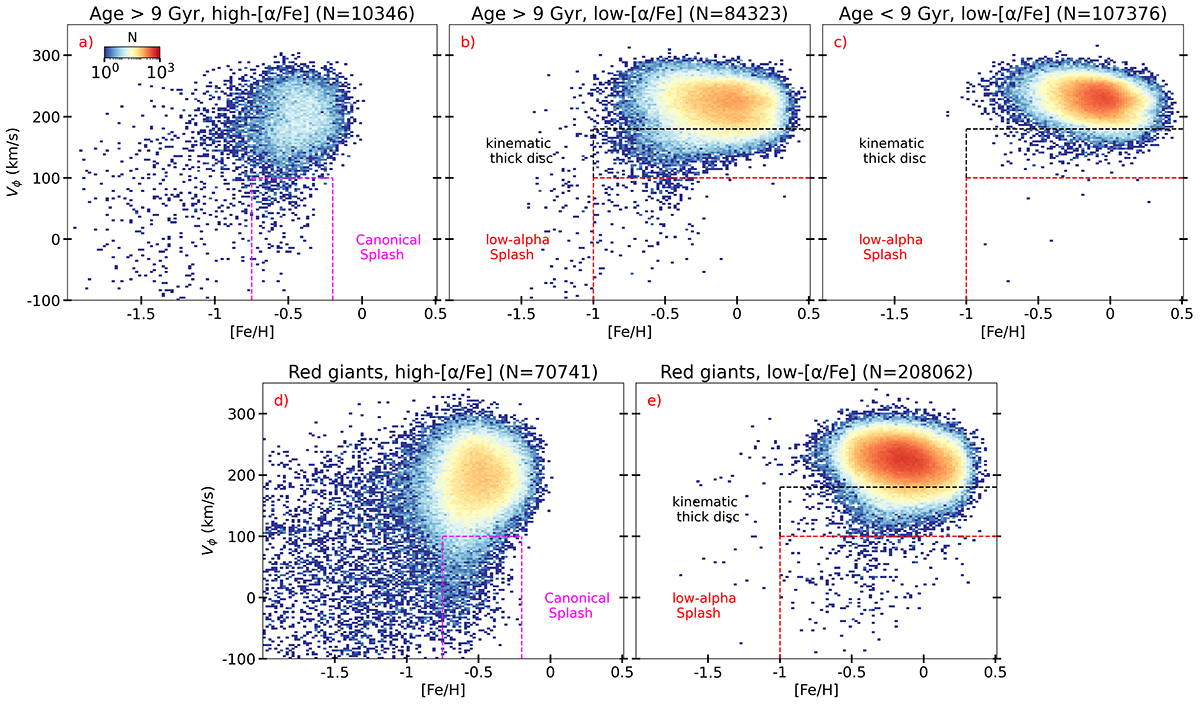
Download original image
Vϕ vs. [Fe/H] for the identification of Splash. The 2D density plots (panels a–e) are colour coded according to the number of stars per bin in log scale. The major debris contaminants, namely GSE and Sagittarius, are excluded from these plots. Panels (a), (b), and (c) show stars from the age sample, while panels (d) and (e) show red giant stars with log(g) > 3 from the full sample. Panels (a) and (d) show the canonical Splash region (magenta box) defined by −100 < Vϕ < +100 and −0.7 < [Fe/H] < − 0.2. Panels (b), (c), and (e) show the region of the kinematic thick disc (red box) defined by velocity 100 < Vϕ < +180. We also define the low-[α/Fe] Splash region as −100 < Vϕ < +100 and −1.0 < [Fe/H] < + 0.5.
Current usage metrics show cumulative count of Article Views (full-text article views including HTML views, PDF and ePub downloads, according to the available data) and Abstracts Views on Vision4Press platform.
Data correspond to usage on the plateform after 2015. The current usage metrics is available 48-96 hours after online publication and is updated daily on week days.
Initial download of the metrics may take a while.