Fig. 3.
Download original image
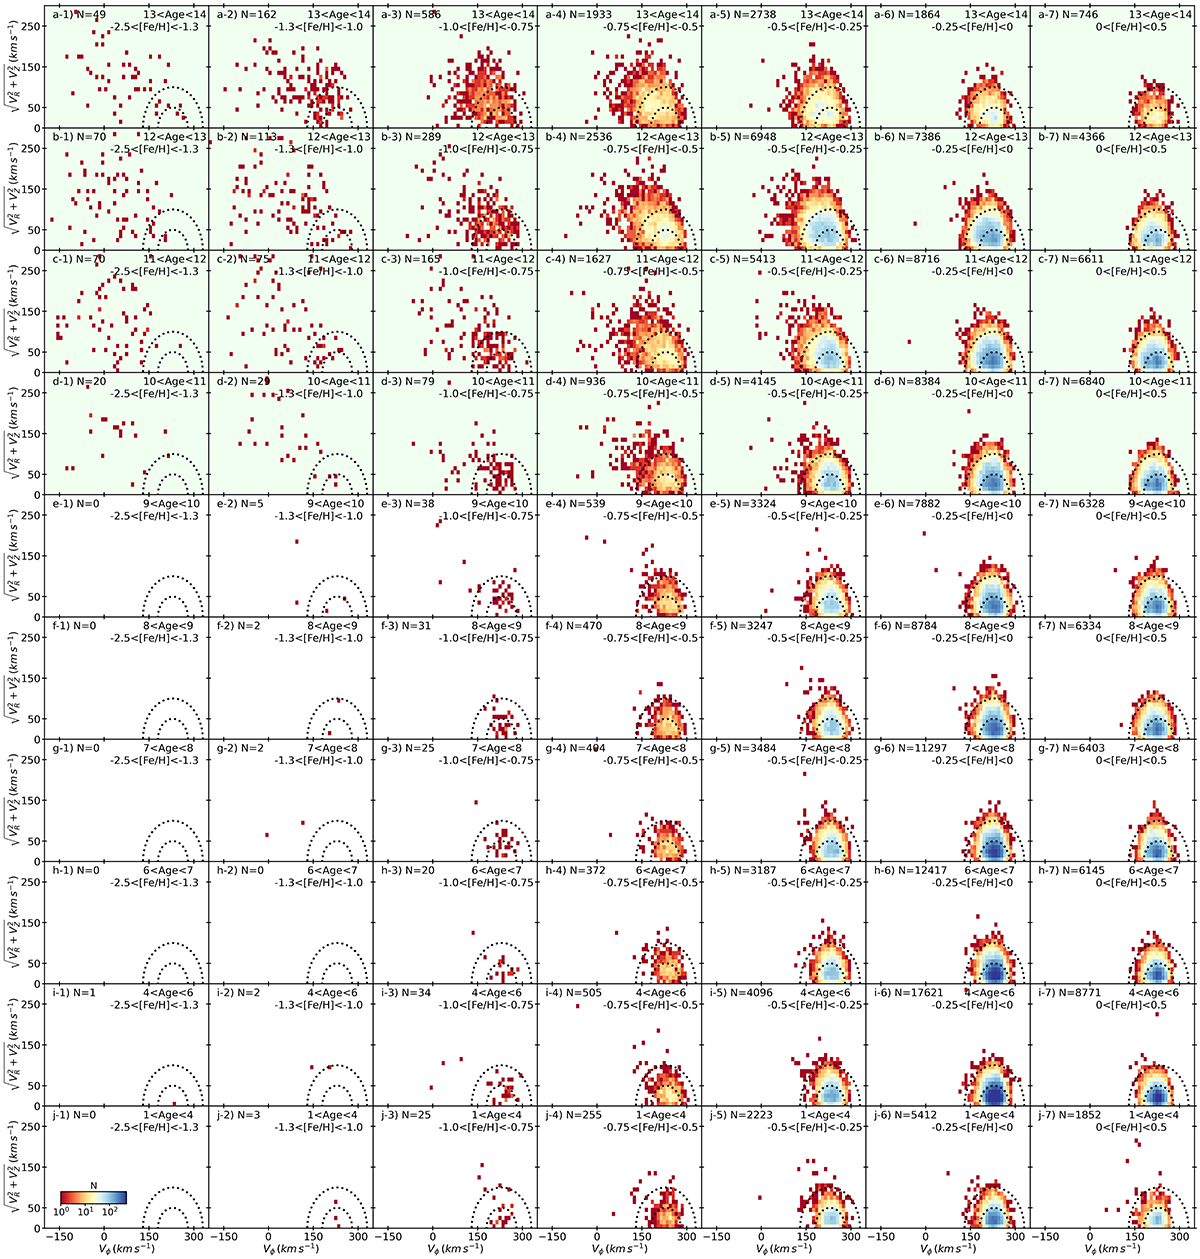
Toomre diagrams (![]() vs. Vϕ) for the age sample stars in bins of age and [Fe/H]. The plots are colour-coded according to the logarithm of stellar density. Older to younger ages are shown from top to bottom and metal-poor to metal-rich [Fe/H] from left to right. The age and [Fe/H] range is shown for each bin along with the respective number of stars. The two dotted black curves represent the velocity boundaries for the thin (|Vtotal − VLSR|< 100 km s−1) and thick (100 ≤ |Vtotal − VLSR|< 200 km s−1) discs. The top four rows highlighted in light green represent the very old ages (10–14 Gyr, demonstrating the large age resolution achievable with of our data). As expected, at the oldest ages we find stars in halo-like orbits as well as accreted debris. However, the unexpected result is the significant number of stars in canonical thin and thick disc orbits at all metallicities, extending to the old metal-poor disc discussed in Sect. 3.1.
vs. Vϕ) for the age sample stars in bins of age and [Fe/H]. The plots are colour-coded according to the logarithm of stellar density. Older to younger ages are shown from top to bottom and metal-poor to metal-rich [Fe/H] from left to right. The age and [Fe/H] range is shown for each bin along with the respective number of stars. The two dotted black curves represent the velocity boundaries for the thin (|Vtotal − VLSR|< 100 km s−1) and thick (100 ≤ |Vtotal − VLSR|< 200 km s−1) discs. The top four rows highlighted in light green represent the very old ages (10–14 Gyr, demonstrating the large age resolution achievable with of our data). As expected, at the oldest ages we find stars in halo-like orbits as well as accreted debris. However, the unexpected result is the significant number of stars in canonical thin and thick disc orbits at all metallicities, extending to the old metal-poor disc discussed in Sect. 3.1.
Current usage metrics show cumulative count of Article Views (full-text article views including HTML views, PDF and ePub downloads, according to the available data) and Abstracts Views on Vision4Press platform.
Data correspond to usage on the plateform after 2015. The current usage metrics is available 48-96 hours after online publication and is updated daily on week days.
Initial download of the metrics may take a while.