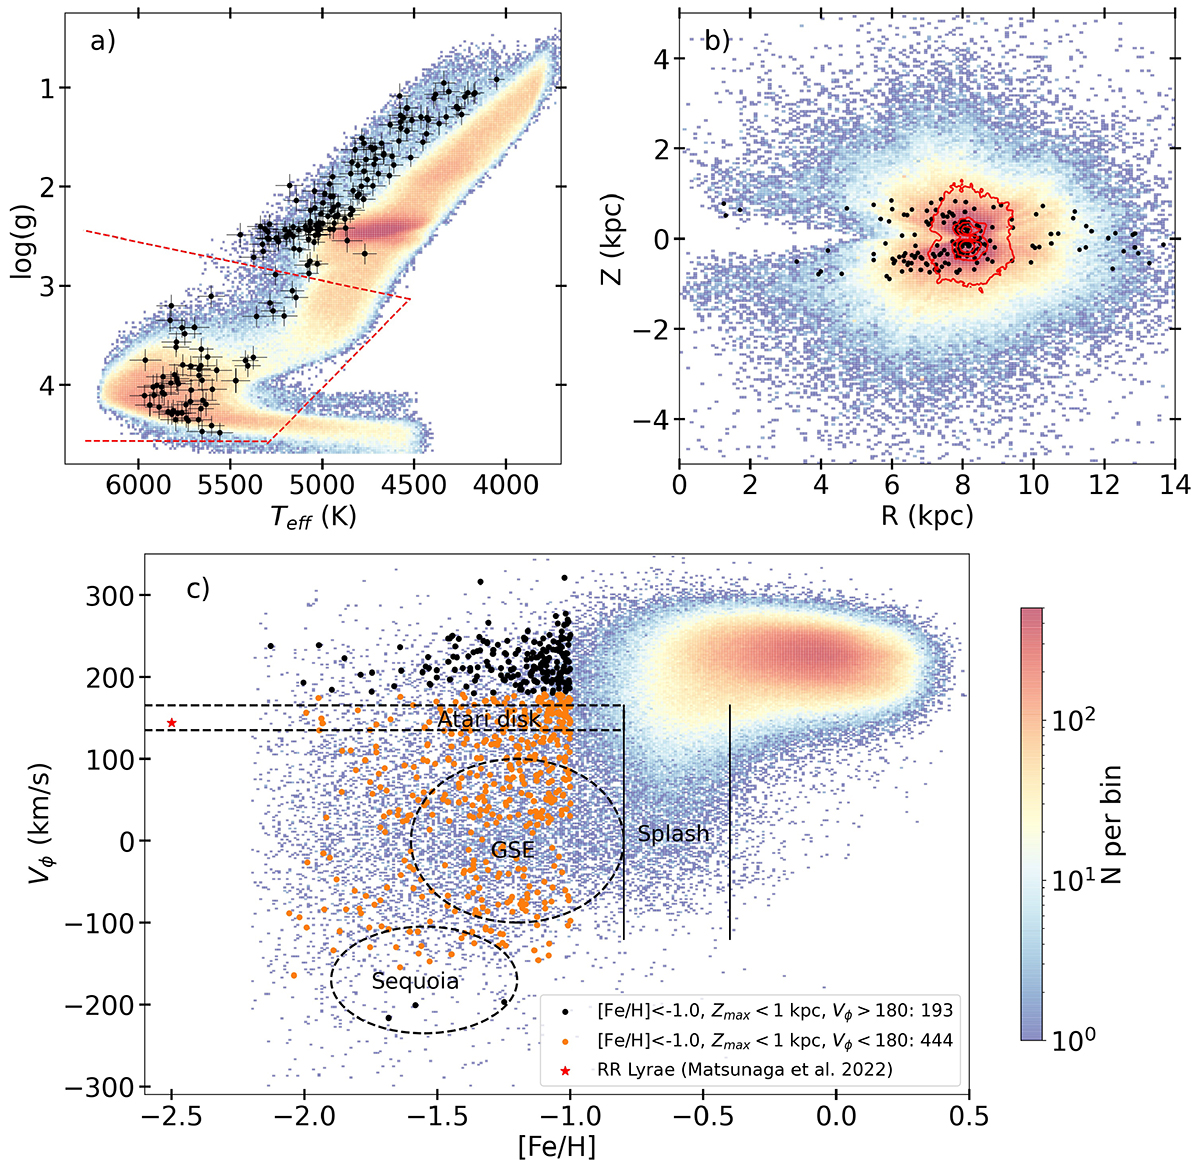
Fig. 1.
Download original image
Properties of the selected samples: (a) Kiel diagram (log(g) vs. Teff) for the full sample colour-coded according to the logarithm of stellar density. The dashed red lines represent the selection of MSTO+SGB stars (i.e. ‘age sample’). The black dots represent the metal-poor stars in thin-disc-like orbits (see legend in panel c) and the error bars show the uncertainties; (b) Distance from the Galactic mid-plane (Z) vs. the Galactocentric radius (R) distribution of the full sample. The red contours show the spatial extent of the age sample and the black dots show how the metal-poor stars in thin-disc-like orbits extend throughout the MW disc; (c) Stars from the full sample in the Vϕ vs. [Fe/H] plane. Several in situ and ex situ components of the MW, namely GSE, Sequoia, Atari disc, and the splash, are also illustrated in the plot. The black (orange) dots represent the metal-poor stars ([Fe/H] < −1.0) confined to Zmax < 1 kpc and with azimuthal velocity > 180 km s−1 (< 180 km s−1). The red star shows the RR Lyrae star found in the solar neighbourhood in disc orbit by Matsunaga et al. (2022). The metal-poor stars in thin-disc-like orbits (black dots) span the full disc of the MW and are discussed in detail in Sect. 3.1.
Current usage metrics show cumulative count of Article Views (full-text article views including HTML views, PDF and ePub downloads, according to the available data) and Abstracts Views on Vision4Press platform.
Data correspond to usage on the plateform after 2015. The current usage metrics is available 48-96 hours after online publication and is updated daily on week days.
Initial download of the metrics may take a while.