Open Access
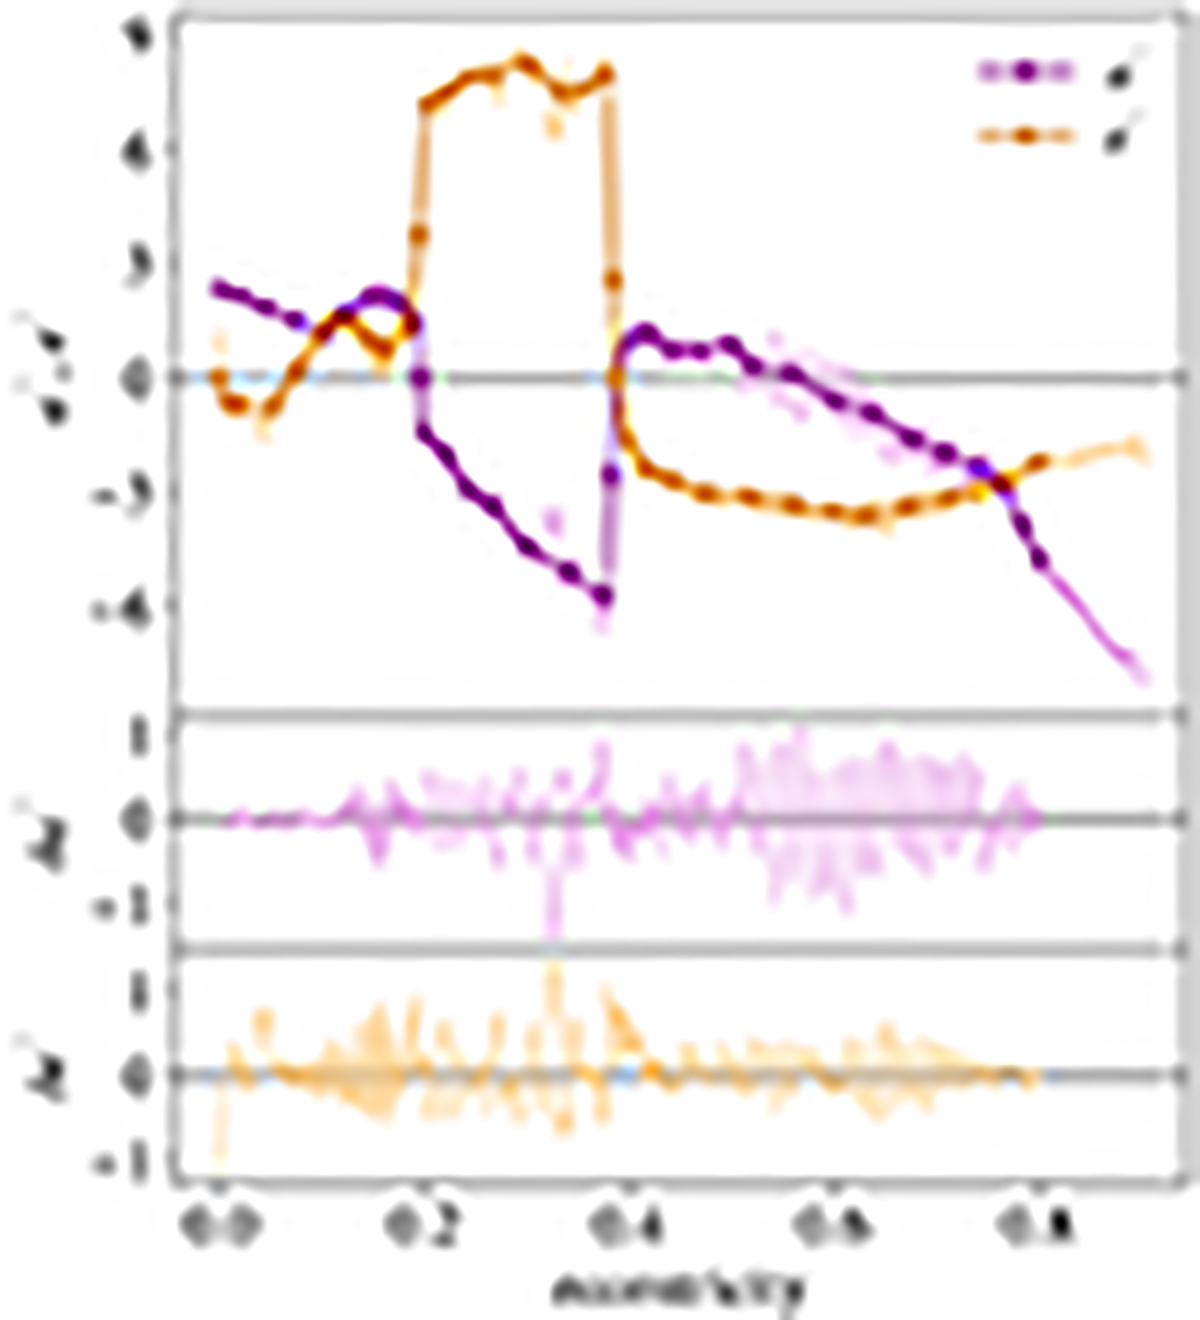
Fig. B.1.
Download original image
Interpolation of the results of DD21. In the top panel, a comparison between the values of a′ and e′ computed in DD21 (lighter solid lines) and the interpolating function used in this work (darker solid lines with dots). The bottom panels show the residuals.
Current usage metrics show cumulative count of Article Views (full-text article views including HTML views, PDF and ePub downloads, according to the available data) and Abstracts Views on Vision4Press platform.
Data correspond to usage on the plateform after 2015. The current usage metrics is available 48-96 hours after online publication and is updated daily on week days.
Initial download of the metrics may take a while.