Open Access
Fig. 7
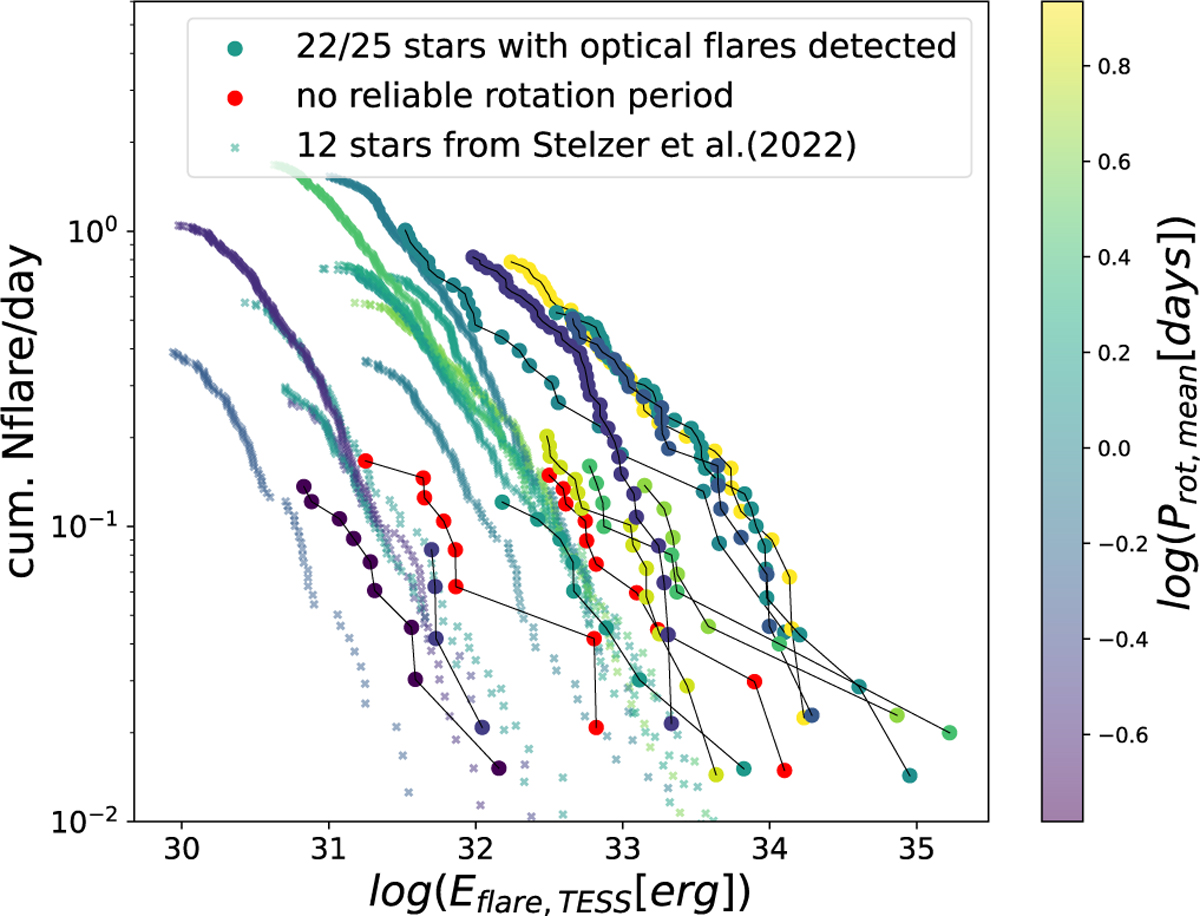
Download original image
Optical flare frequency distributions of the 22 targets with flares detected in the TESS light curves of the sectors overlapping with eRASS (circles). For comparison the FFDs for the fast rotating M dwarfs from the catalog by Kaltenegger et al. (2019) that were studied by Stelzer et al. (2022a) are shown ( small crosses).
Current usage metrics show cumulative count of Article Views (full-text article views including HTML views, PDF and ePub downloads, according to the available data) and Abstracts Views on Vision4Press platform.
Data correspond to usage on the plateform after 2015. The current usage metrics is available 48-96 hours after online publication and is updated daily on week days.
Initial download of the metrics may take a while.