Open Access
Fig. 5
Download original image
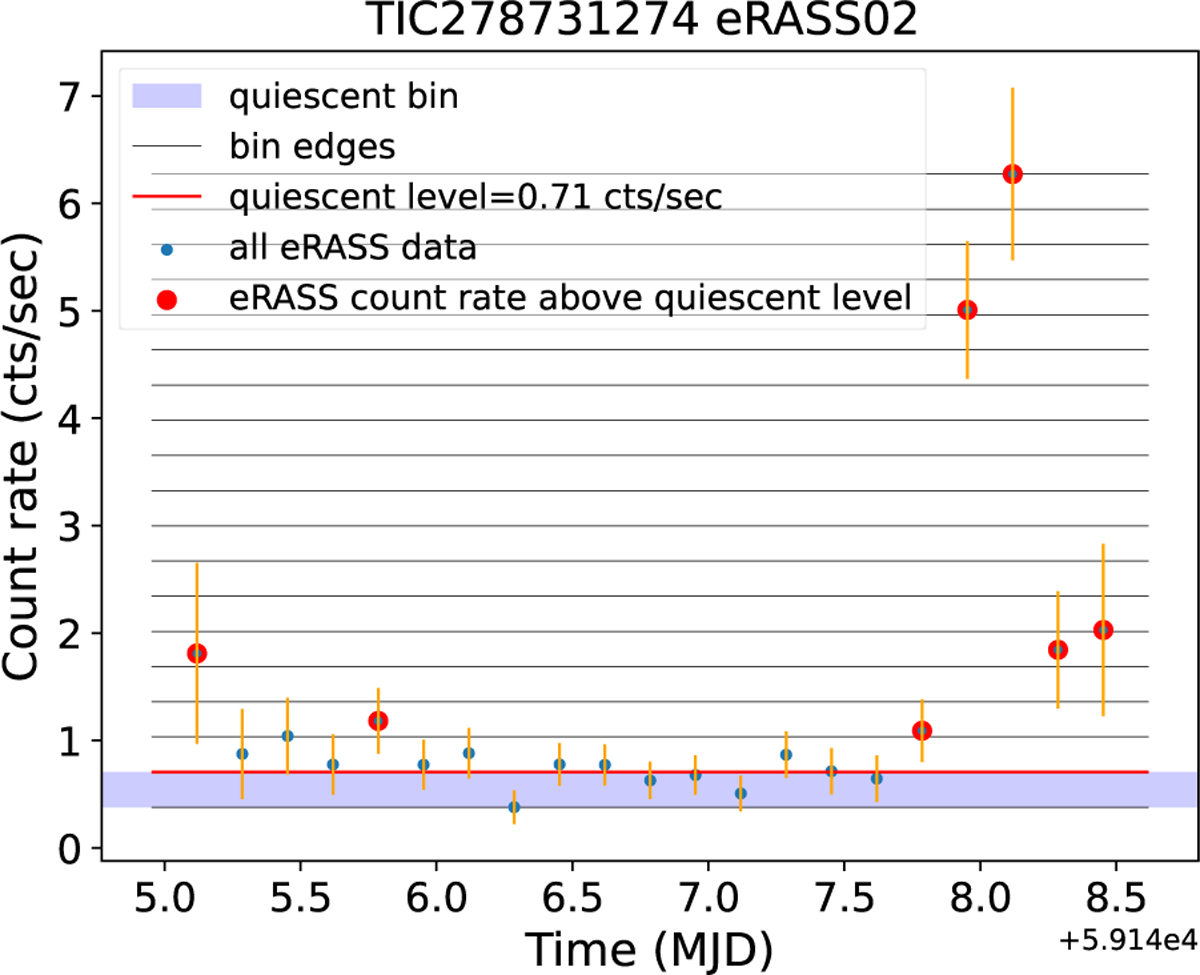
Example of an eRASS light curve (the M dwarf TIC278731274 observed in eRASS2) demonstrating the definition of the quiescent count rate level, Rqui, and the selection of variable light curve bins (namely eROdays significantly above Rqui; see text in Sects. 5.2 and 5.3)
Current usage metrics show cumulative count of Article Views (full-text article views including HTML views, PDF and ePub downloads, according to the available data) and Abstracts Views on Vision4Press platform.
Data correspond to usage on the plateform after 2015. The current usage metrics is available 48-96 hours after online publication and is updated daily on week days.
Initial download of the metrics may take a while.