Fig. 3
Download original image
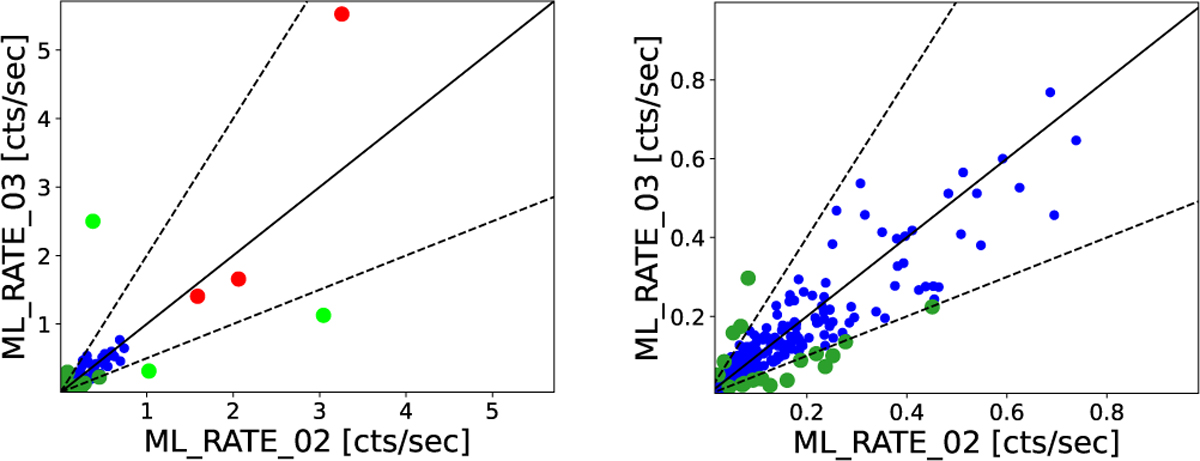
Variation of the X-ray count rate in the 0.2–5.0 ke V band between eRASS2 and eRASS3 for the M dwarfs in the TESS SCVZ. Left panel – all stars, right panel – zoom into the low count rate region. The lines denote equal count rates in both surveys (solid) and differences of a factor two (dashed). The X-ray brightest stars (Eq. (1)) are high-lighted in red, the most X-ray variable (Eq. (2)) in green and stars that fulfil both critera in lime. See Sect. 3.4 for details.
Current usage metrics show cumulative count of Article Views (full-text article views including HTML views, PDF and ePub downloads, according to the available data) and Abstracts Views on Vision4Press platform.
Data correspond to usage on the plateform after 2015. The current usage metrics is available 48-96 hours after online publication and is updated daily on week days.
Initial download of the metrics may take a while.