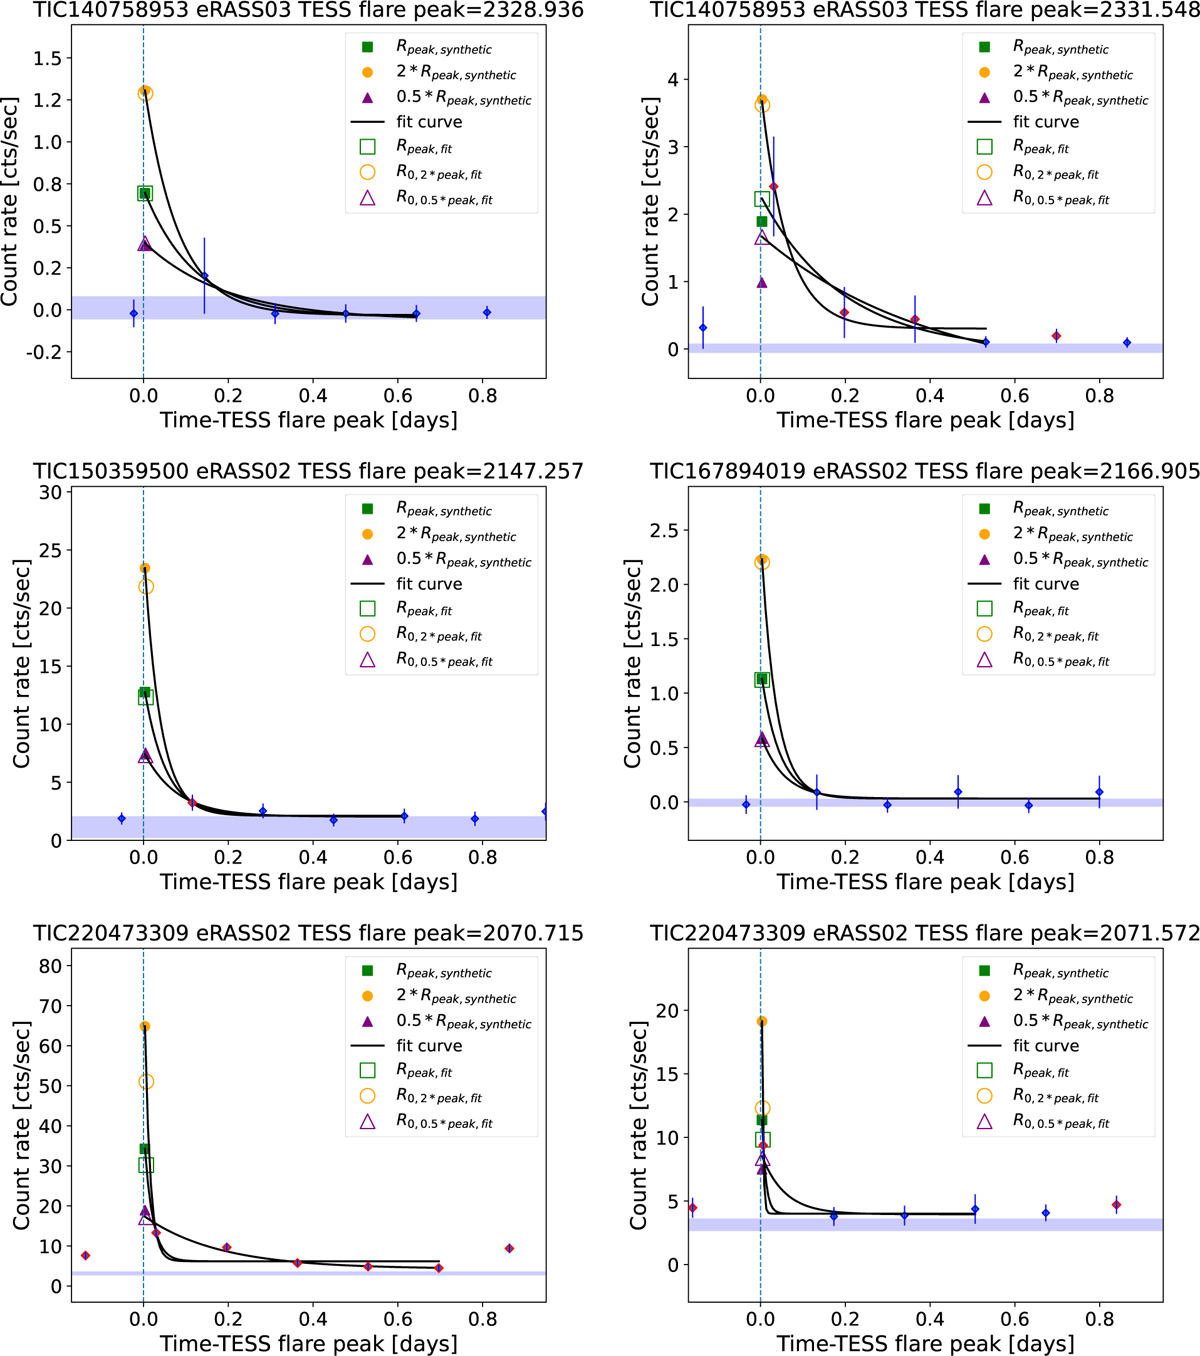
Fig. C.1
Download original image
17 Exponential fits (black; see Sect. 7.5.2) to suspected X-ray flares in eRASS light curves following TESS flares. The Synthetic flare peaks (original, factor two upscaled and downscaled; see 7.5.1) and the flare peaks obtained from the corresponding fits are depicted by filled and open green squares, yellow circles and purple triangles respectively.
Current usage metrics show cumulative count of Article Views (full-text article views including HTML views, PDF and ePub downloads, according to the available data) and Abstracts Views on Vision4Press platform.
Data correspond to usage on the plateform after 2015. The current usage metrics is available 48-96 hours after online publication and is updated daily on week days.
Initial download of the metrics may take a while.