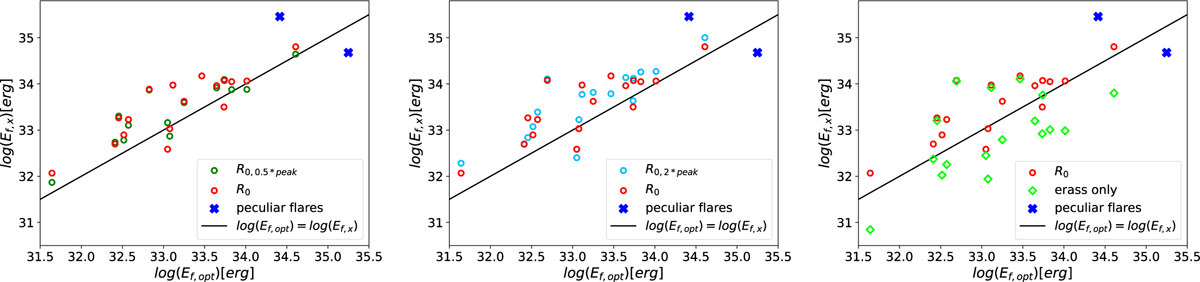
Fig. 16
Download original image
X-ray flare energies from exponential fits normalized to R0 versus TESS flare energies. The energies calculated from fits made to the synthethic flare peaks (red) and normalized to R0 are compared with those made to the synthetic flare peak scaled down by a factor two (left panel, green circles) and up by factor two (middle panel, teal circles) respectively, and from fits made to the original synthetic peak but integrated over the flare light curve starting from the first eRASS bin (right panel, light green diamonds). The peculiar flares described in Sect. 7.5.4 are marked as blue crosses. The black line denotes equal optical and X-ray flare energies.
Current usage metrics show cumulative count of Article Views (full-text article views including HTML views, PDF and ePub downloads, according to the available data) and Abstracts Views on Vision4Press platform.
Data correspond to usage on the plateform after 2015. The current usage metrics is available 48-96 hours after online publication and is updated daily on week days.
Initial download of the metrics may take a while.