Open Access
Fig. 14
Download original image
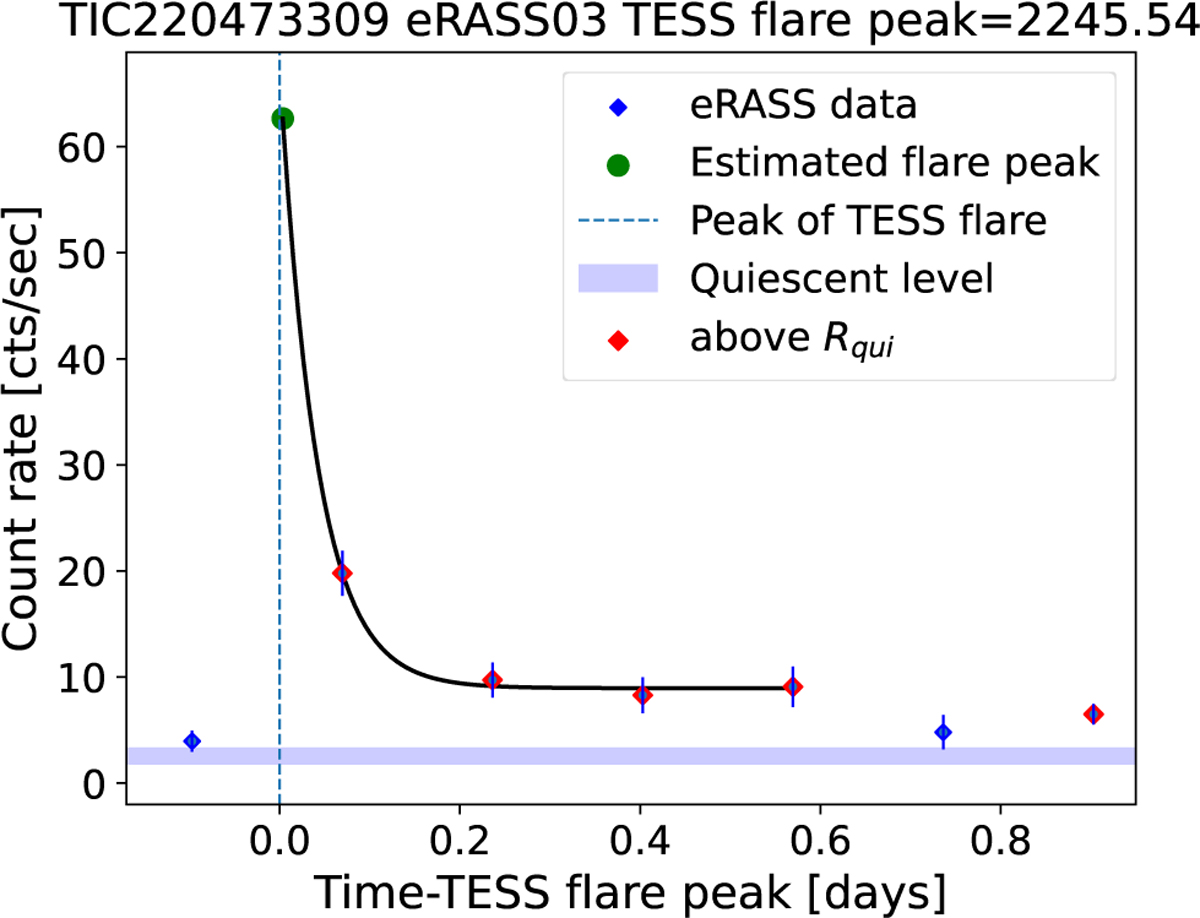
eRASS3 light curve of TIC 220473309 illustrating our estimate of the X-ray flare peak (green data point) as explained in Sect. 7.5.1 and the exponential fit to the flare decay (black curve) described in Sect. 7.5.2.
Current usage metrics show cumulative count of Article Views (full-text article views including HTML views, PDF and ePub downloads, according to the available data) and Abstracts Views on Vision4Press platform.
Data correspond to usage on the plateform after 2015. The current usage metrics is available 48-96 hours after online publication and is updated daily on week days.
Initial download of the metrics may take a while.