Fig. 12
Download original image
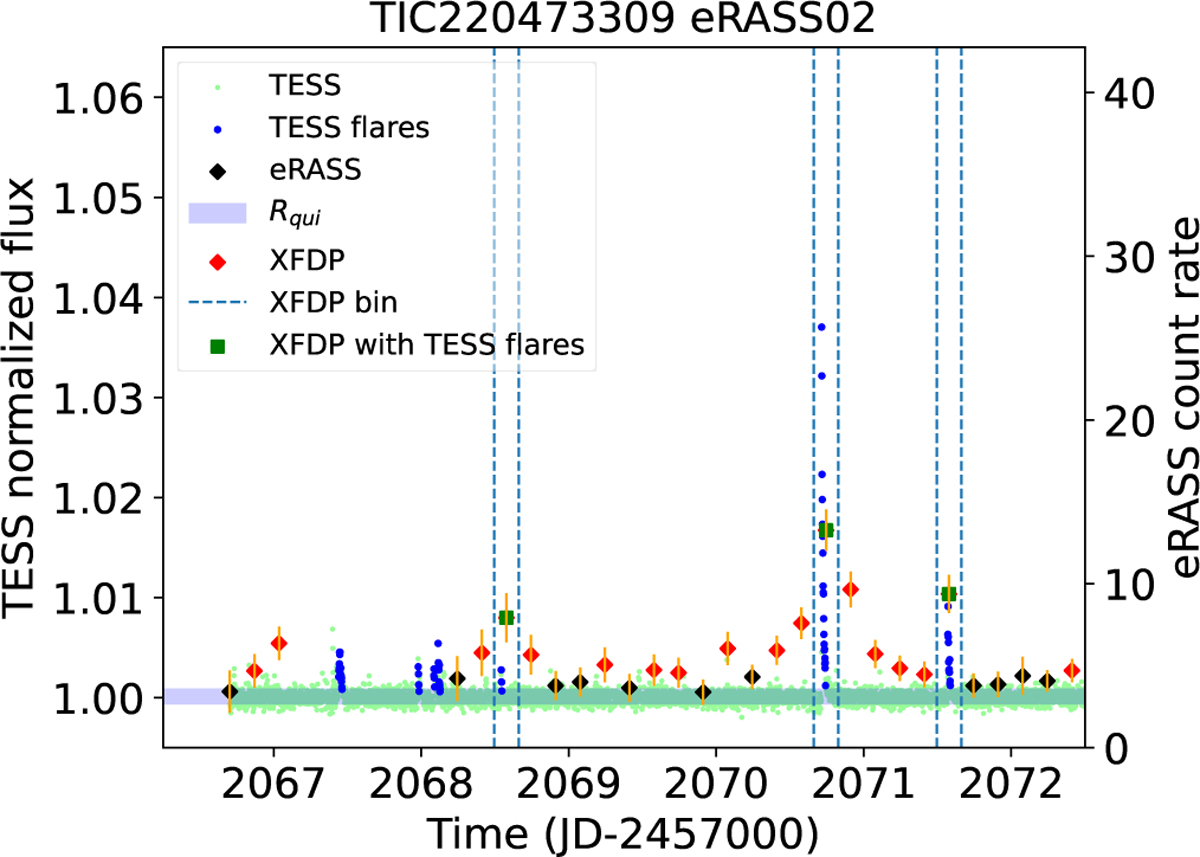
Example of a flattened TESS light curve and eRASS light curve for TIC 220473309 observed during the eRASS2 epoch of the star. The eRASS data points significantly above the quiescent level (purple-shaded area), also named as the ‘X-ray flare data points’ (XFDPs), are marked in red. The TESS flare data points are marked in dark blue. XFDPs around which TESS flares were found are marked as green squares, and the vertical bins of width 1 eROday in which they lie are marked with dashed blue lines.
Current usage metrics show cumulative count of Article Views (full-text article views including HTML views, PDF and ePub downloads, according to the available data) and Abstracts Views on Vision4Press platform.
Data correspond to usage on the plateform after 2015. The current usage metrics is available 48-96 hours after online publication and is updated daily on week days.
Initial download of the metrics may take a while.