Open Access
Fig. 11
Download original image
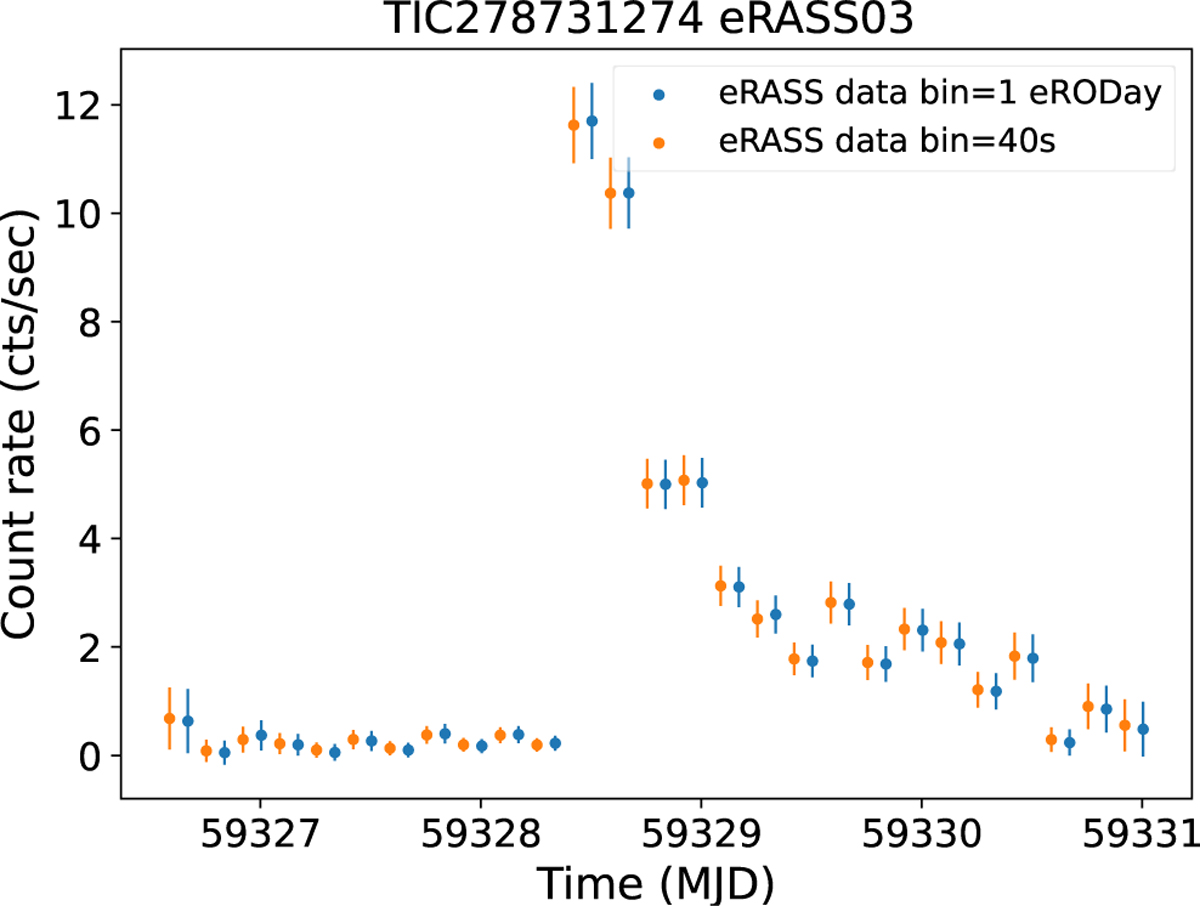
Example of an eRASS light curved binned at 40 s, with bins close in time being combined (orange) and the same light curve binned at 1 eRODay. For this example the time-shift between the two light curves is roughly 2 h or 1/2 eRODay.
Current usage metrics show cumulative count of Article Views (full-text article views including HTML views, PDF and ePub downloads, according to the available data) and Abstracts Views on Vision4Press platform.
Data correspond to usage on the plateform after 2015. The current usage metrics is available 48-96 hours after online publication and is updated daily on week days.
Initial download of the metrics may take a while.