Fig. 1
Download original image
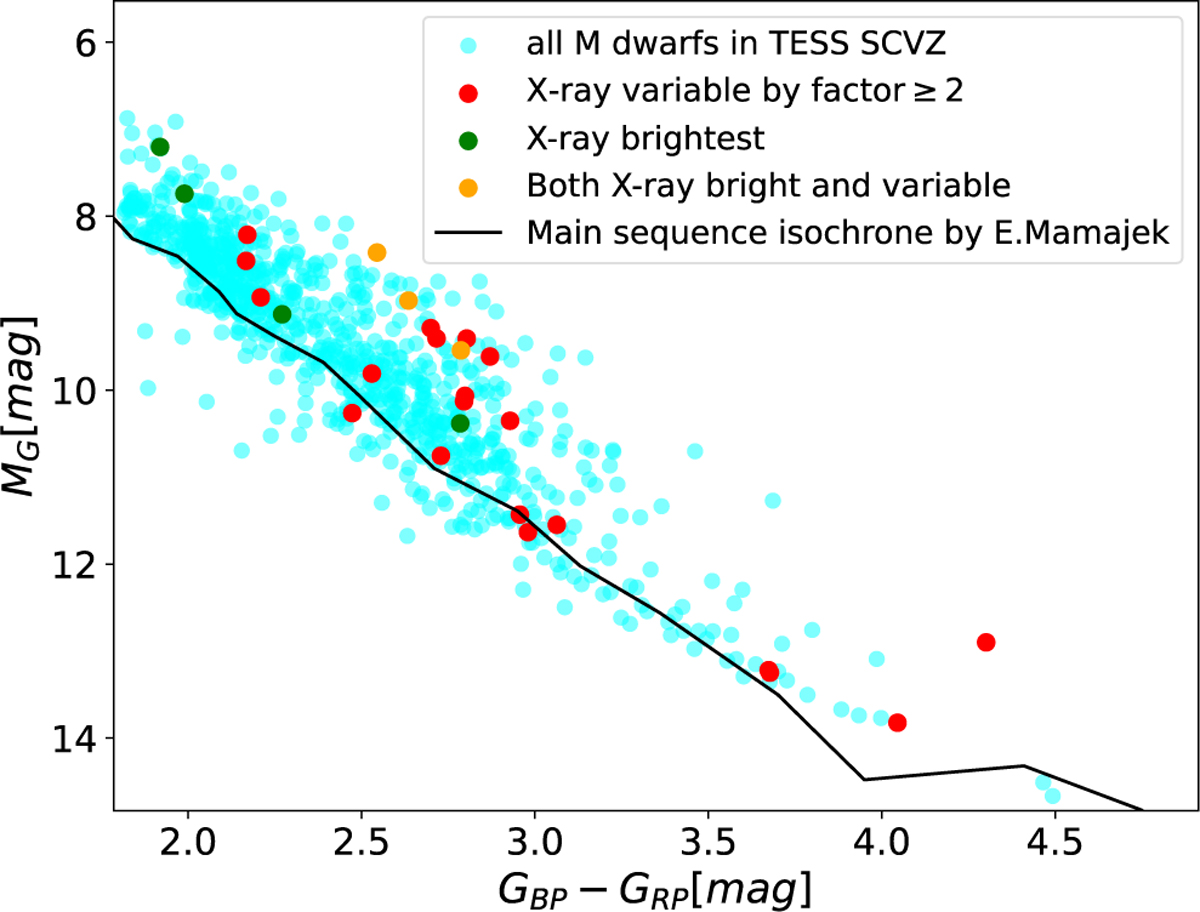
Colour-magnitude diagram for M dwarfs in the TESS SCVZ (cyan) with the two samples defined in Sect. 3.4 highlighted in green (count rate ≥ 1 cts s−1) and red (count rate ratio between eRASS2 and eRASS3 ≥ 2 cts s−1). The overlap between the two samples are marked in orange. Overplotted is the main sequence isochrone (black) from the table ‘A Modern Mean Dwarf Stellar Color and Effective Temperature Sequence’ by E. Mamajek (https://www.pas.rochester.edu/~emamajek/EEM_dwarf_UBVIJHK_colors_Teff.txt).
Current usage metrics show cumulative count of Article Views (full-text article views including HTML views, PDF and ePub downloads, according to the available data) and Abstracts Views on Vision4Press platform.
Data correspond to usage on the plateform after 2015. The current usage metrics is available 48-96 hours after online publication and is updated daily on week days.
Initial download of the metrics may take a while.