Fig. 6.
Download original image
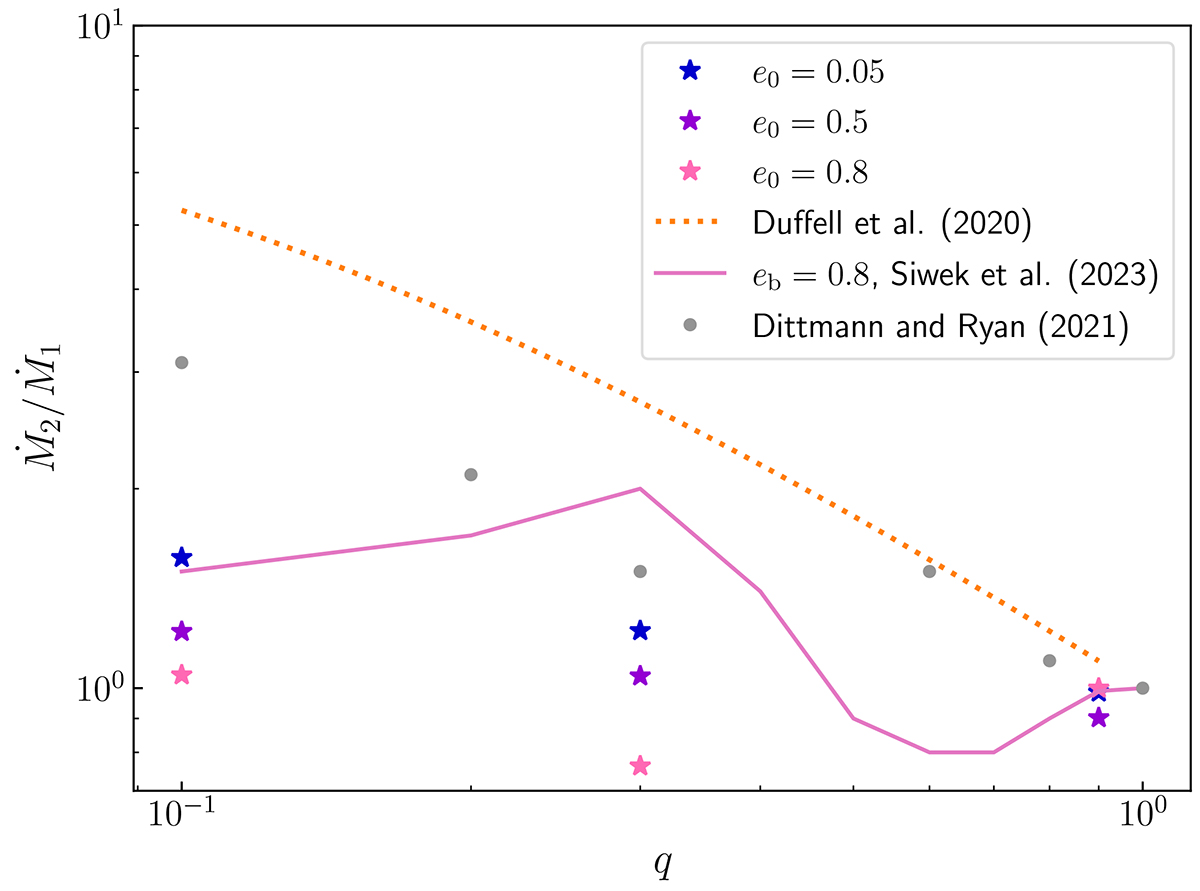
Mass-ratio growth as function of the initial binary mass ratio calculated over the simulated 1000 Pb. The blue, violet, and pink stars show our results for e0 = 0.05, e0 = 0.5, and e0 = 0.8, respectively. The orange dotted line shows the result obtained for circular binaries by Duffell et al. (2020), while the pink solid line shows the result obtained for binaries with eb = 0.8 by Siwek et al. (2023b). The grey dots show the values obtained by Dittmann & Ryan (2021) for circular binaries.
Current usage metrics show cumulative count of Article Views (full-text article views including HTML views, PDF and ePub downloads, according to the available data) and Abstracts Views on Vision4Press platform.
Data correspond to usage on the plateform after 2015. The current usage metrics is available 48-96 hours after online publication and is updated daily on week days.
Initial download of the metrics may take a while.