Fig. 4.
Download original image
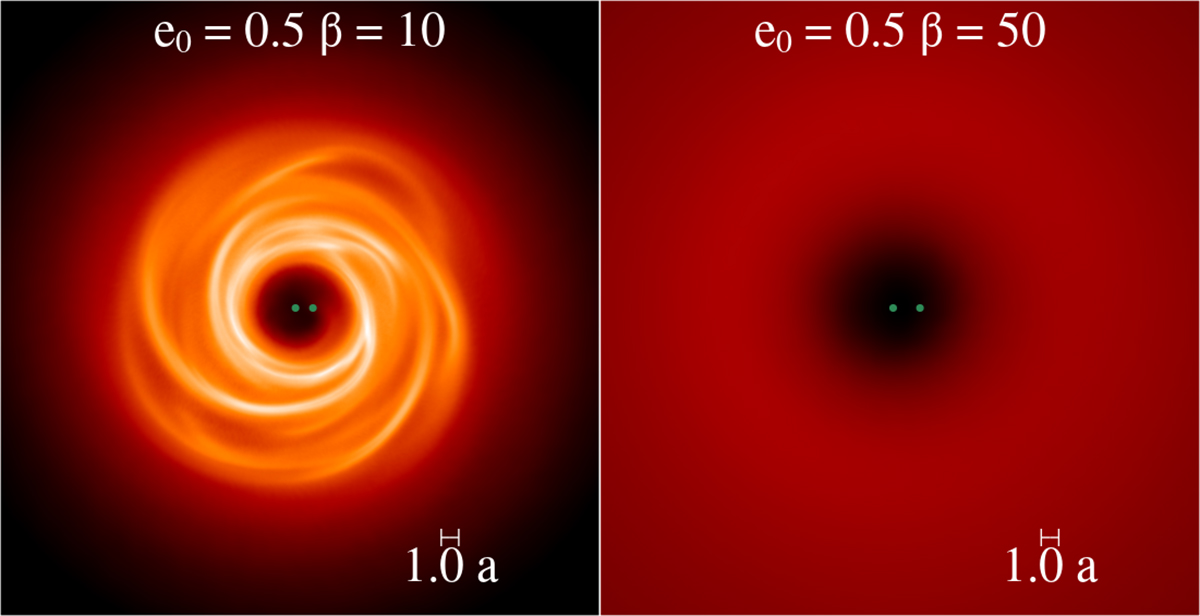
Column density plots of self-gravitating circumbinary disc around the binary (shown by the green circles). The view is of the x − y plane (i.e. the binary orbital plane), and the density has been integrated through z. The logarithmic colour scale spans about two orders of magnitude in density and is the same for all the plots.
Current usage metrics show cumulative count of Article Views (full-text article views including HTML views, PDF and ePub downloads, according to the available data) and Abstracts Views on Vision4Press platform.
Data correspond to usage on the plateform after 2015. The current usage metrics is available 48-96 hours after online publication and is updated daily on week days.
Initial download of the metrics may take a while.