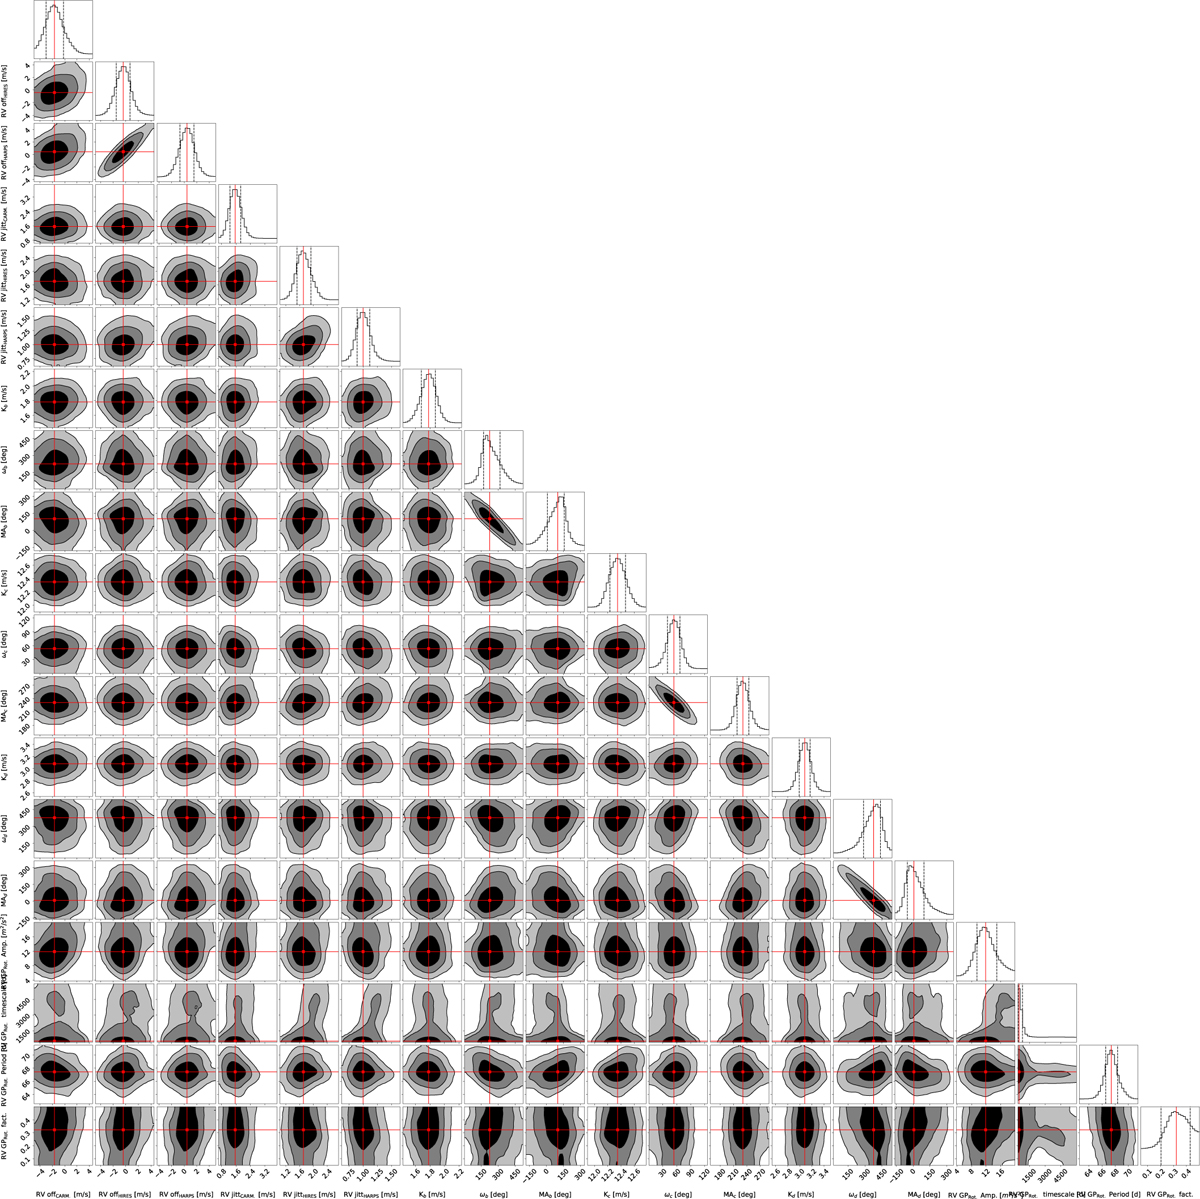
Fig. A.4
Download original image
The remaining posteriors of the dynamical properties of the best-fit dynamical model that are not displayed in the main text. The two-dimensional contours indicate 1-, 2- and 3-σ confidence levels of the posterior distribution. The red crosses indicate the median of the posterior probability distribution. Top to bottom and left to right: The RV offsets of CARMENES, HIRES and HARPS, respectively, the RV jitter, as well as the mean semi-amplitude K, mean argument of periapsis ω, the mean anomaly MA of each planet and the GP rotational kernel amplitude, time scale, period, and factor.
Current usage metrics show cumulative count of Article Views (full-text article views including HTML views, PDF and ePub downloads, according to the available data) and Abstracts Views on Vision4Press platform.
Data correspond to usage on the plateform after 2015. The current usage metrics is available 48-96 hours after online publication and is updated daily on week days.
Initial download of the metrics may take a while.