Fig. A.3
Download original image
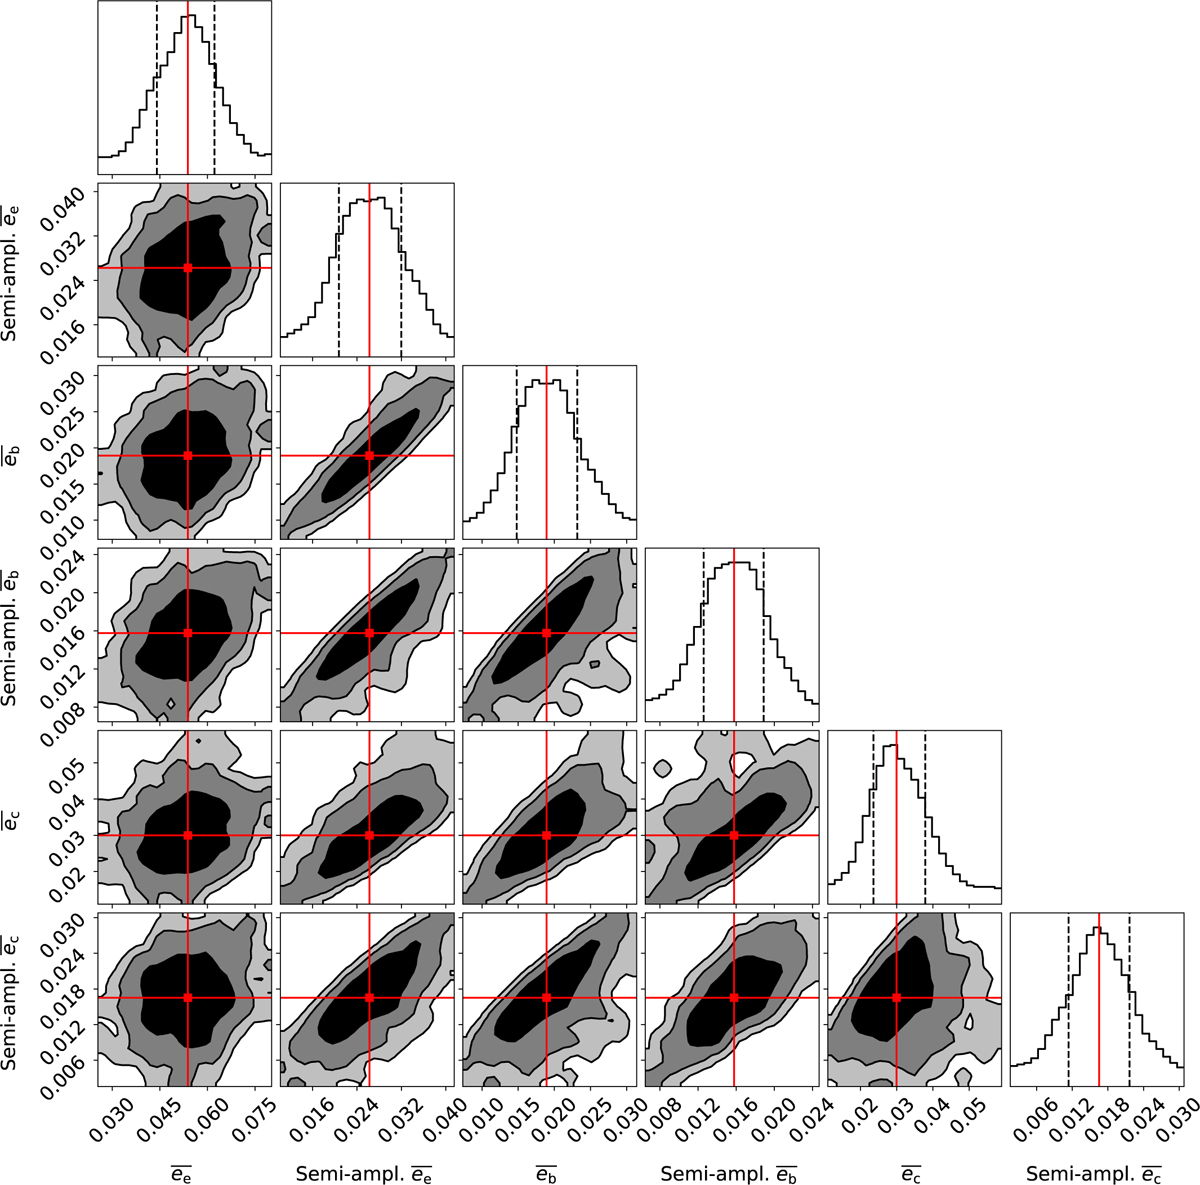
Distribution of 1,000 randomly sampled NS posteriors from the coplanar inclined model (see Fig. A.2) integrated over 10,000 years. The two-dimensional contours represent the 1-, 2-, and 3-σ confidence intervals of the stable posterior distribution. From top to bottom, the corner plot shows the mean osculating planetary eccentricities and osculating eccentricity semi-amplitudes for the three planets, pivotal for assessing the GJ 581 system’s dynamical properties. The median values of the complete posterior distributions are indicated by red lines.
Current usage metrics show cumulative count of Article Views (full-text article views including HTML views, PDF and ePub downloads, according to the available data) and Abstracts Views on Vision4Press platform.
Data correspond to usage on the plateform after 2015. The current usage metrics is available 48-96 hours after online publication and is updated daily on week days.
Initial download of the metrics may take a while.