Fig. 12
Download original image
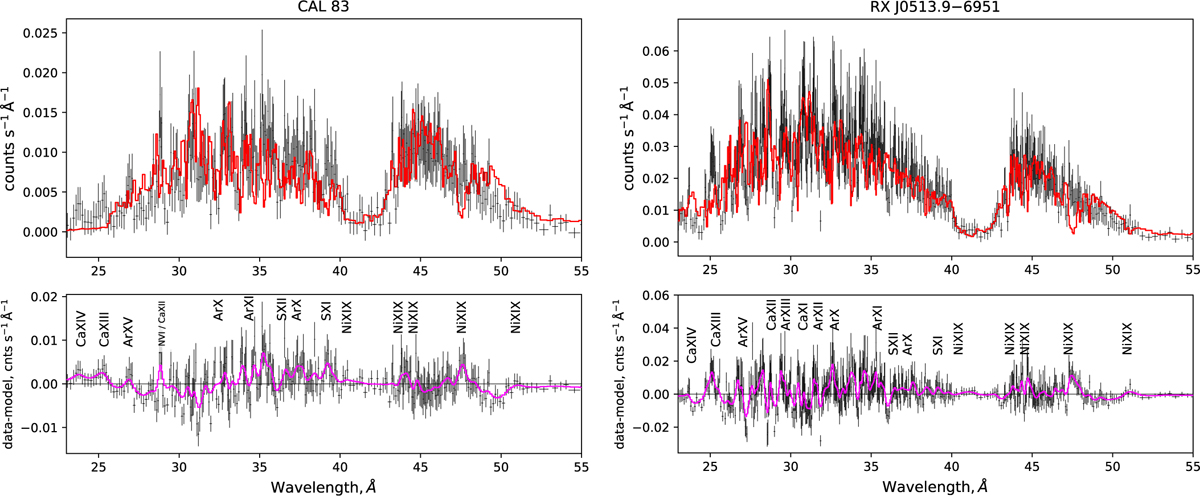
Best fits of CAL 83 (left) and RX J0513.9–6951 (right) spectra (top). The observed spectra (Chandra, black curves) and the model fits (red curves) are shown. Residuals and the smoothed residuals (magenta curves) of the fits (bottom). Any possible identifications of the most prominent residual features as resonance lines of highly charged ions of some heavy elements are indicated. The best-fit parameters are presented in Table 2.
Current usage metrics show cumulative count of Article Views (full-text article views including HTML views, PDF and ePub downloads, according to the available data) and Abstracts Views on Vision4Press platform.
Data correspond to usage on the plateform after 2015. The current usage metrics is available 48-96 hours after online publication and is updated daily on week days.
Initial download of the metrics may take a while.