Fig. 1
Download original image
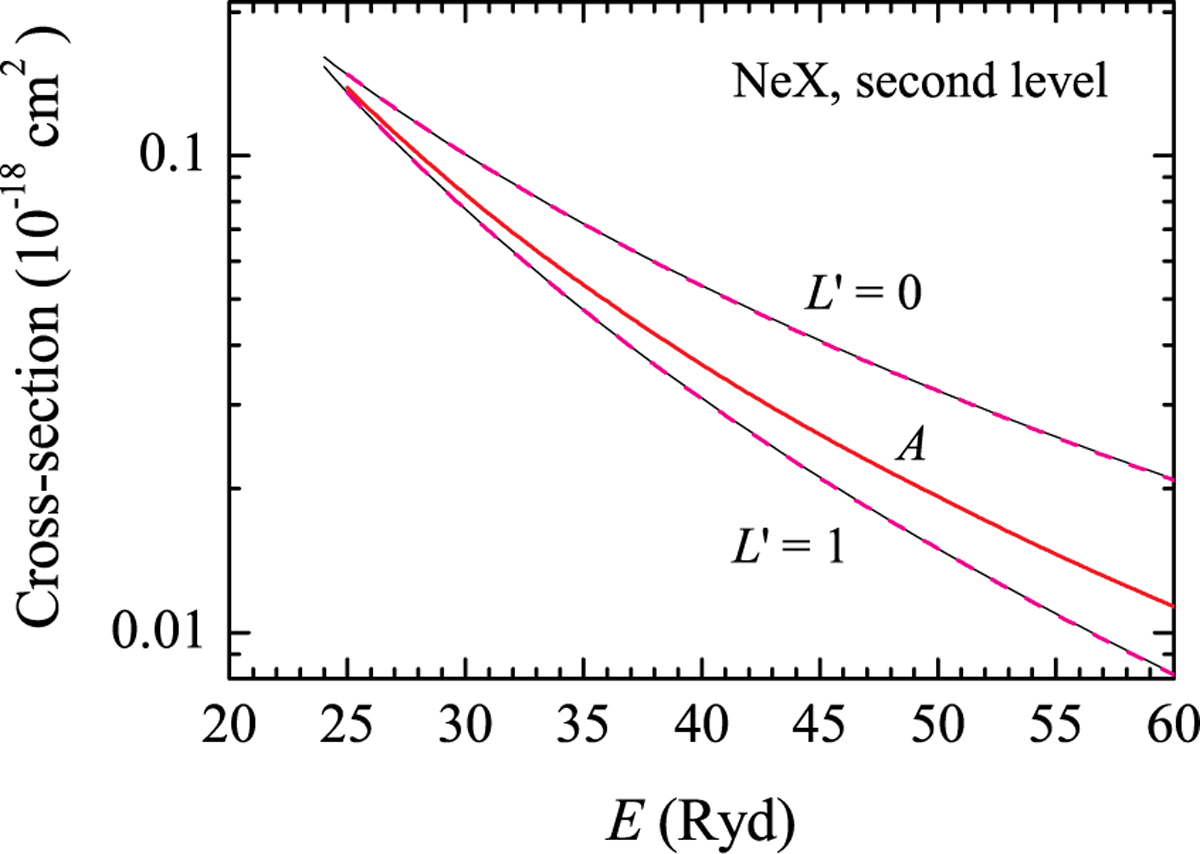
Comparison of the photoionization cross-sections of the lowest excited levels of the hydrogen-like ion Ne X with the orbital quantum numbers L′ = 0 and 1, computed by OP (thin black curves) and by the used approximation (dashed magenta curves). The g-factor weighted averaged over both sub-level cross-sections is shown by the red curve.
Current usage metrics show cumulative count of Article Views (full-text article views including HTML views, PDF and ePub downloads, according to the available data) and Abstracts Views on Vision4Press platform.
Data correspond to usage on the plateform after 2015. The current usage metrics is available 48-96 hours after online publication and is updated daily on week days.
Initial download of the metrics may take a while.