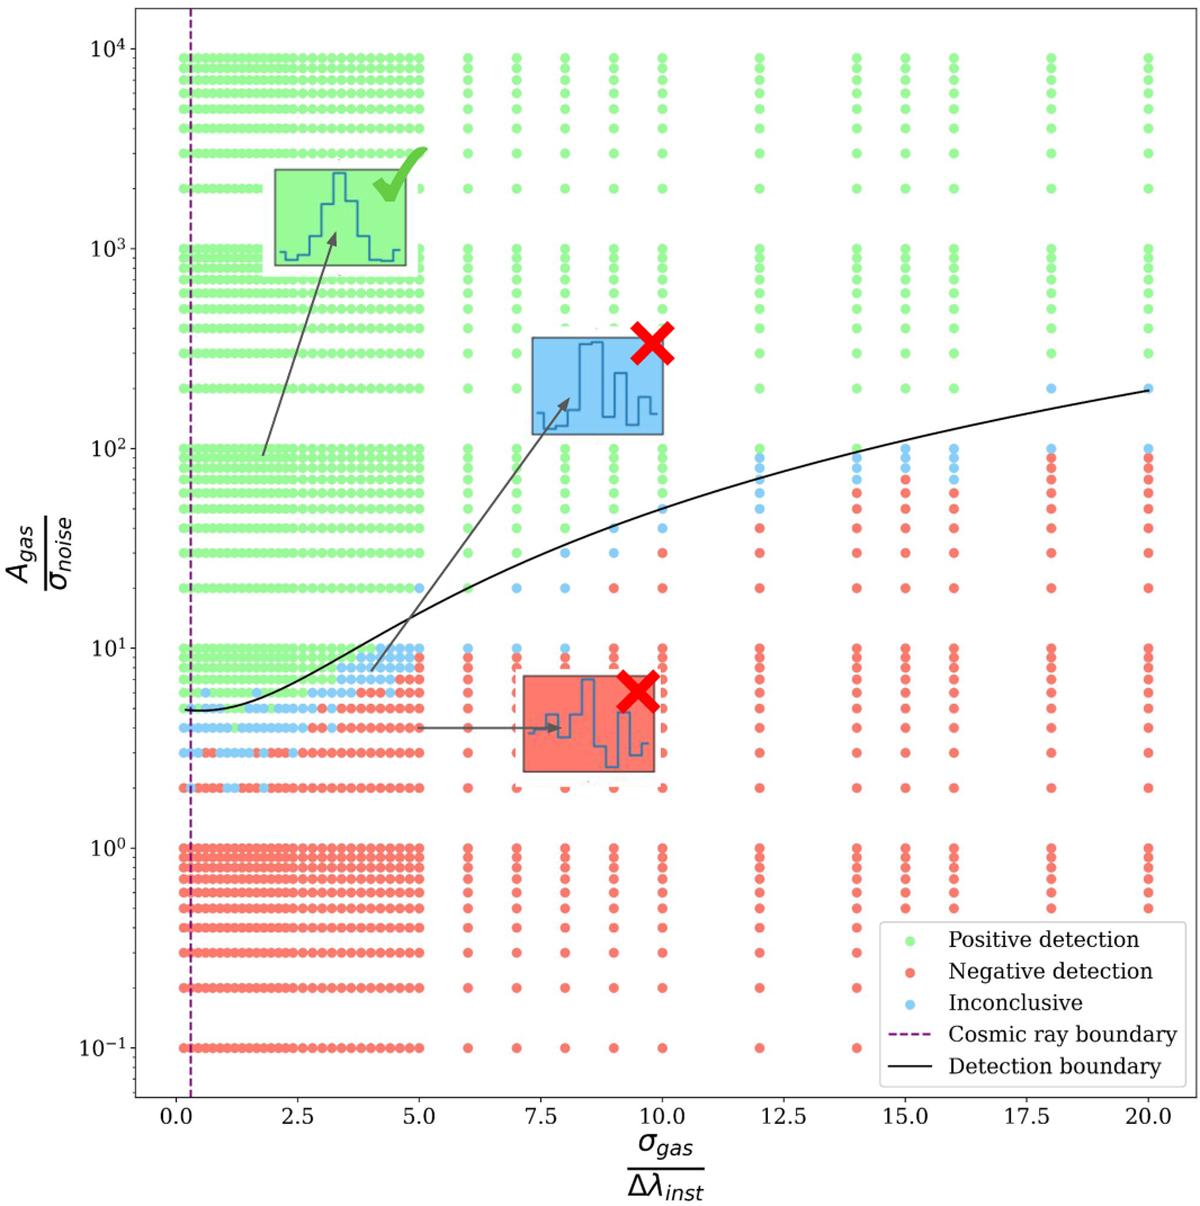
Fig. 8
Download original image
Parameter space for line measurement as described in the text, with scatter points color-coded according to a visual criterion for line detection. In the color version, these are green for positive detection, red for negative, and blue for inconclusive. The inset plots show examples of each case. The black solid line represents the empirical detection boundary.
Current usage metrics show cumulative count of Article Views (full-text article views including HTML views, PDF and ePub downloads, according to the available data) and Abstracts Views on Vision4Press platform.
Data correspond to usage on the plateform after 2015. The current usage metrics is available 48-96 hours after online publication and is updated daily on week days.
Initial download of the metrics may take a while.