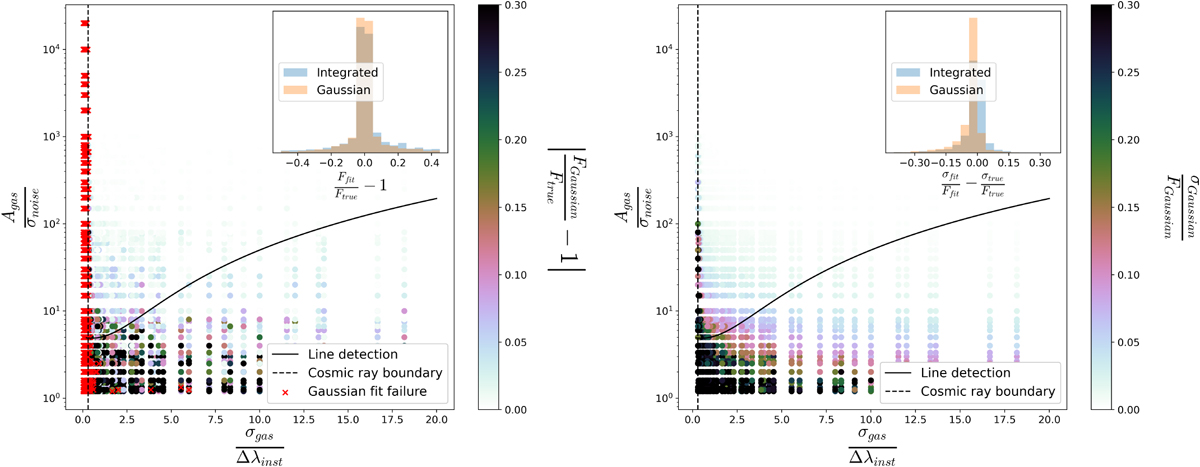
Fig. 7
Download original image
Accuracy and precision evaluation plots for parameters contributing to a line flux’s nominal and standard deviation values: line amplitude (Agas), standard deviation (σgas), line flux noise (σnoise), and spectrum resolution (∆λinst). The black solid line indicates the emission line detection boundary, and dashed lines represent the cosmic rays (or dead pixel) “lines” limit. Each circle represents the Gaussian fitting of a synthetic line. Left: points are color-coded by the absolute relative error between measured and true flux. Inset histogram shows relative error of integrated and Gaussian fluxes. Red crosses indicate points where LIME Gaussian fitting failed. Right: points color-coded by coefficient of variation for Gaussian uncertainty and nominal flux. Inset histogram shows difference between Gaussian and integrated fluxes against true coefficient of variation.
Current usage metrics show cumulative count of Article Views (full-text article views including HTML views, PDF and ePub downloads, according to the available data) and Abstracts Views on Vision4Press platform.
Data correspond to usage on the plateform after 2015. The current usage metrics is available 48-96 hours after online publication and is updated daily on week days.
Initial download of the metrics may take a while.