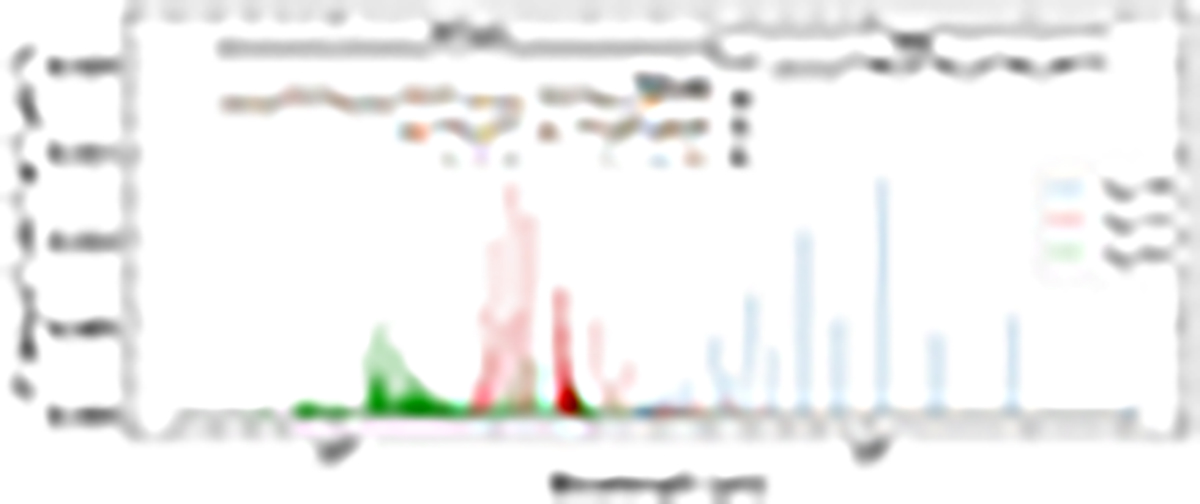
Fig. 7.

Download original image
Predicted synthetic spectrum of H2 in 3C 326 N obtained for the fiducial model (nH = 10 cm−3, b = 0.1, and G0 = 10). The specific intensities of the strongest 1000 emission lines are shown as functions of the redshifted wavelength for z = 0.089. We applied the relations described in Sect. 5.3 for the resolving power of the NIRSpec and MIRI instruments. Outside the validity wavelength range, we fixed the resolving power to a value of λ/Δλ = 2500. The NIRSpec and MIRI bandwidths correspond to the black solid lines. The wide-, medium-, and narrowband filters for NIRCam and MIRI are shown as gray and colored bars. Pure rotation lines are indicated in blue, while ro-vibrational transitions are shown in red and green.
Current usage metrics show cumulative count of Article Views (full-text article views including HTML views, PDF and ePub downloads, according to the available data) and Abstracts Views on Vision4Press platform.
Data correspond to usage on the plateform after 2015. The current usage metrics is available 48-96 hours after online publication and is updated daily on week days.
Initial download of the metrics may take a while.


