Open Access
Fig. 6.
Download original image
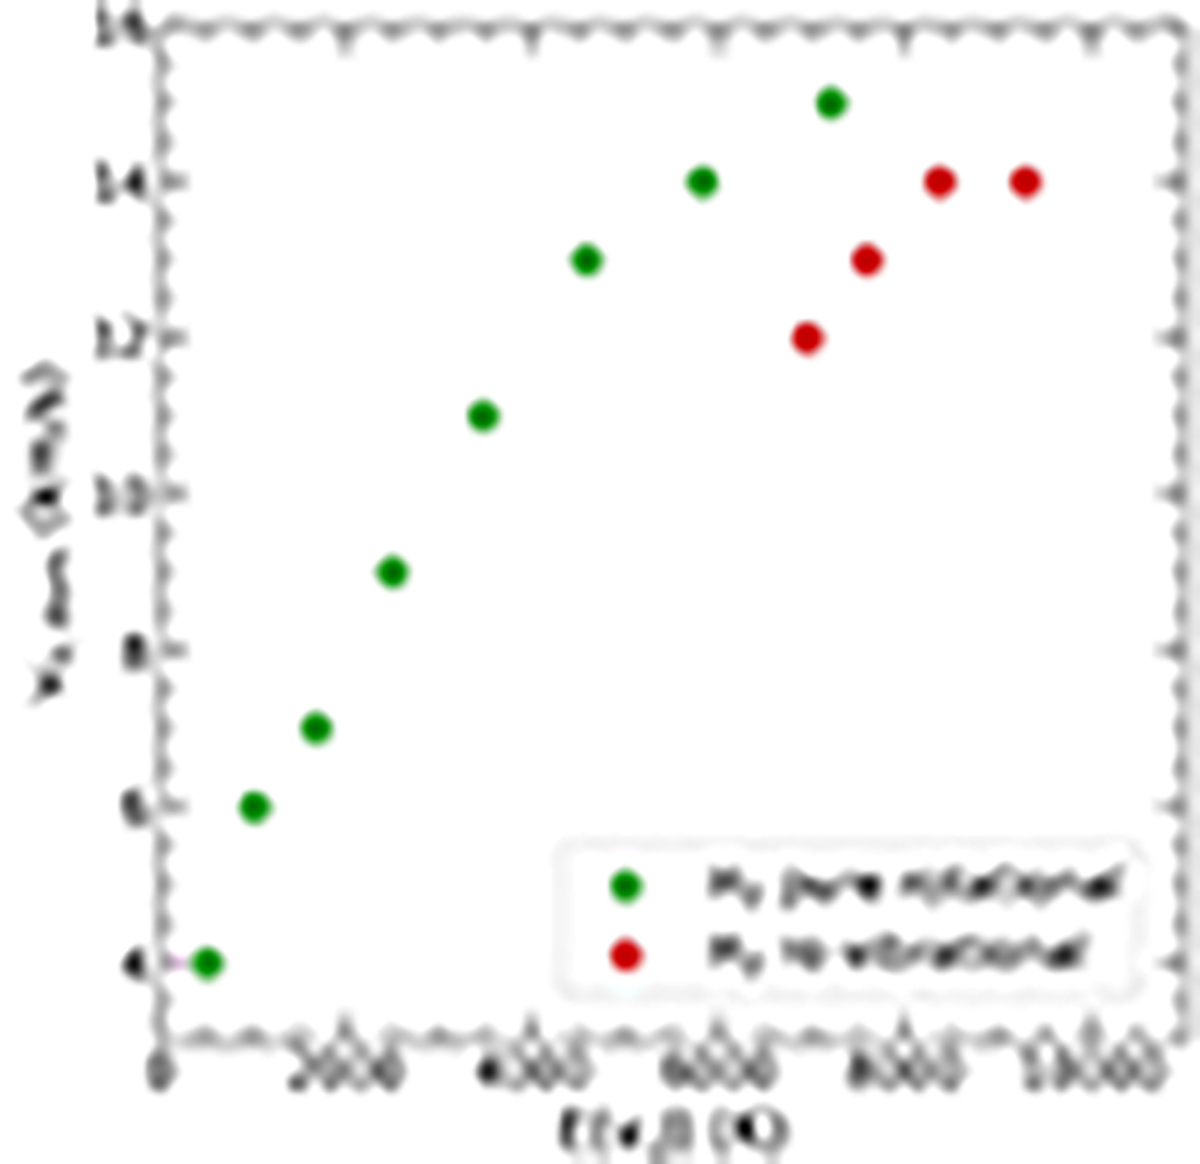
Shock velocity that contributes the most to the H2 line emissions as a function of the upper-level energy (orange points in Fig. 5). H2 pure-rotational (green) and ro-vibrational (red) transitions are presented. vs, dom is derived for the fiducial model nH = 10 cm−3, b = 0.1, and G0 = 10.
Current usage metrics show cumulative count of Article Views (full-text article views including HTML views, PDF and ePub downloads, according to the available data) and Abstracts Views on Vision4Press platform.
Data correspond to usage on the plateform after 2015. The current usage metrics is available 48-96 hours after online publication and is updated daily on week days.
Initial download of the metrics may take a while.