Fig. 4.
Download original image
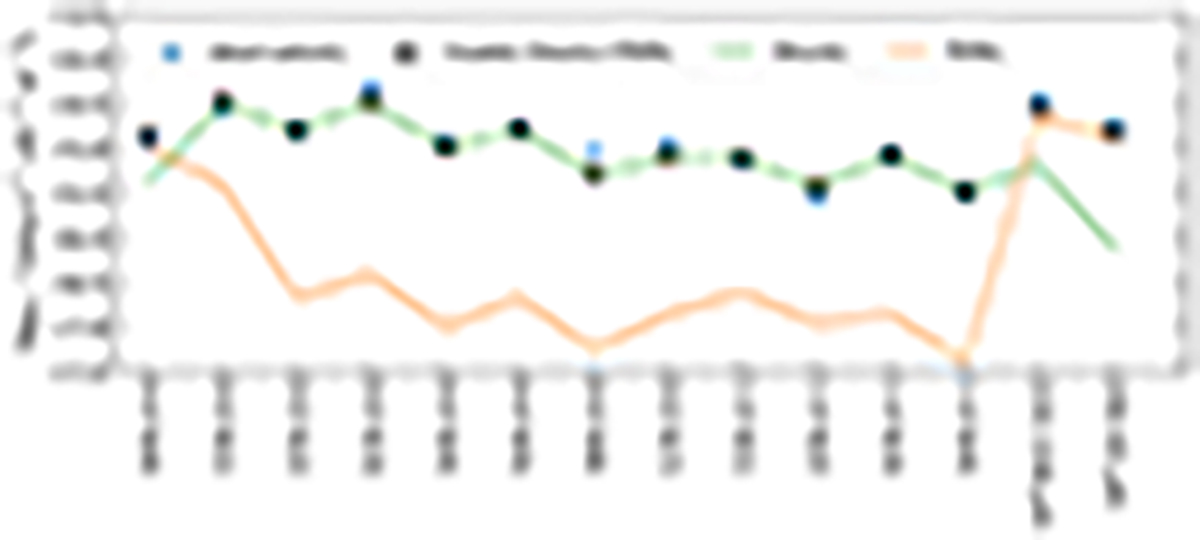
Solution for a combination of shocks and PDRs, assuming an exponential probability distribution function. Solution for the fiducial model nH = 10 cm−3, b = 0.1, G0 = 10 shown in Fig. 3a. Observations are presented as blue stars (see Table B.2) and modeled intensities are shown as open black circles. Individual shock and PDR contributions are shown as green and orange solid lines, respectively.
Current usage metrics show cumulative count of Article Views (full-text article views including HTML views, PDF and ePub downloads, according to the available data) and Abstracts Views on Vision4Press platform.
Data correspond to usage on the plateform after 2015. The current usage metrics is available 48-96 hours after online publication and is updated daily on week days.
Initial download of the metrics may take a while.