Fig. 3.
Download original image
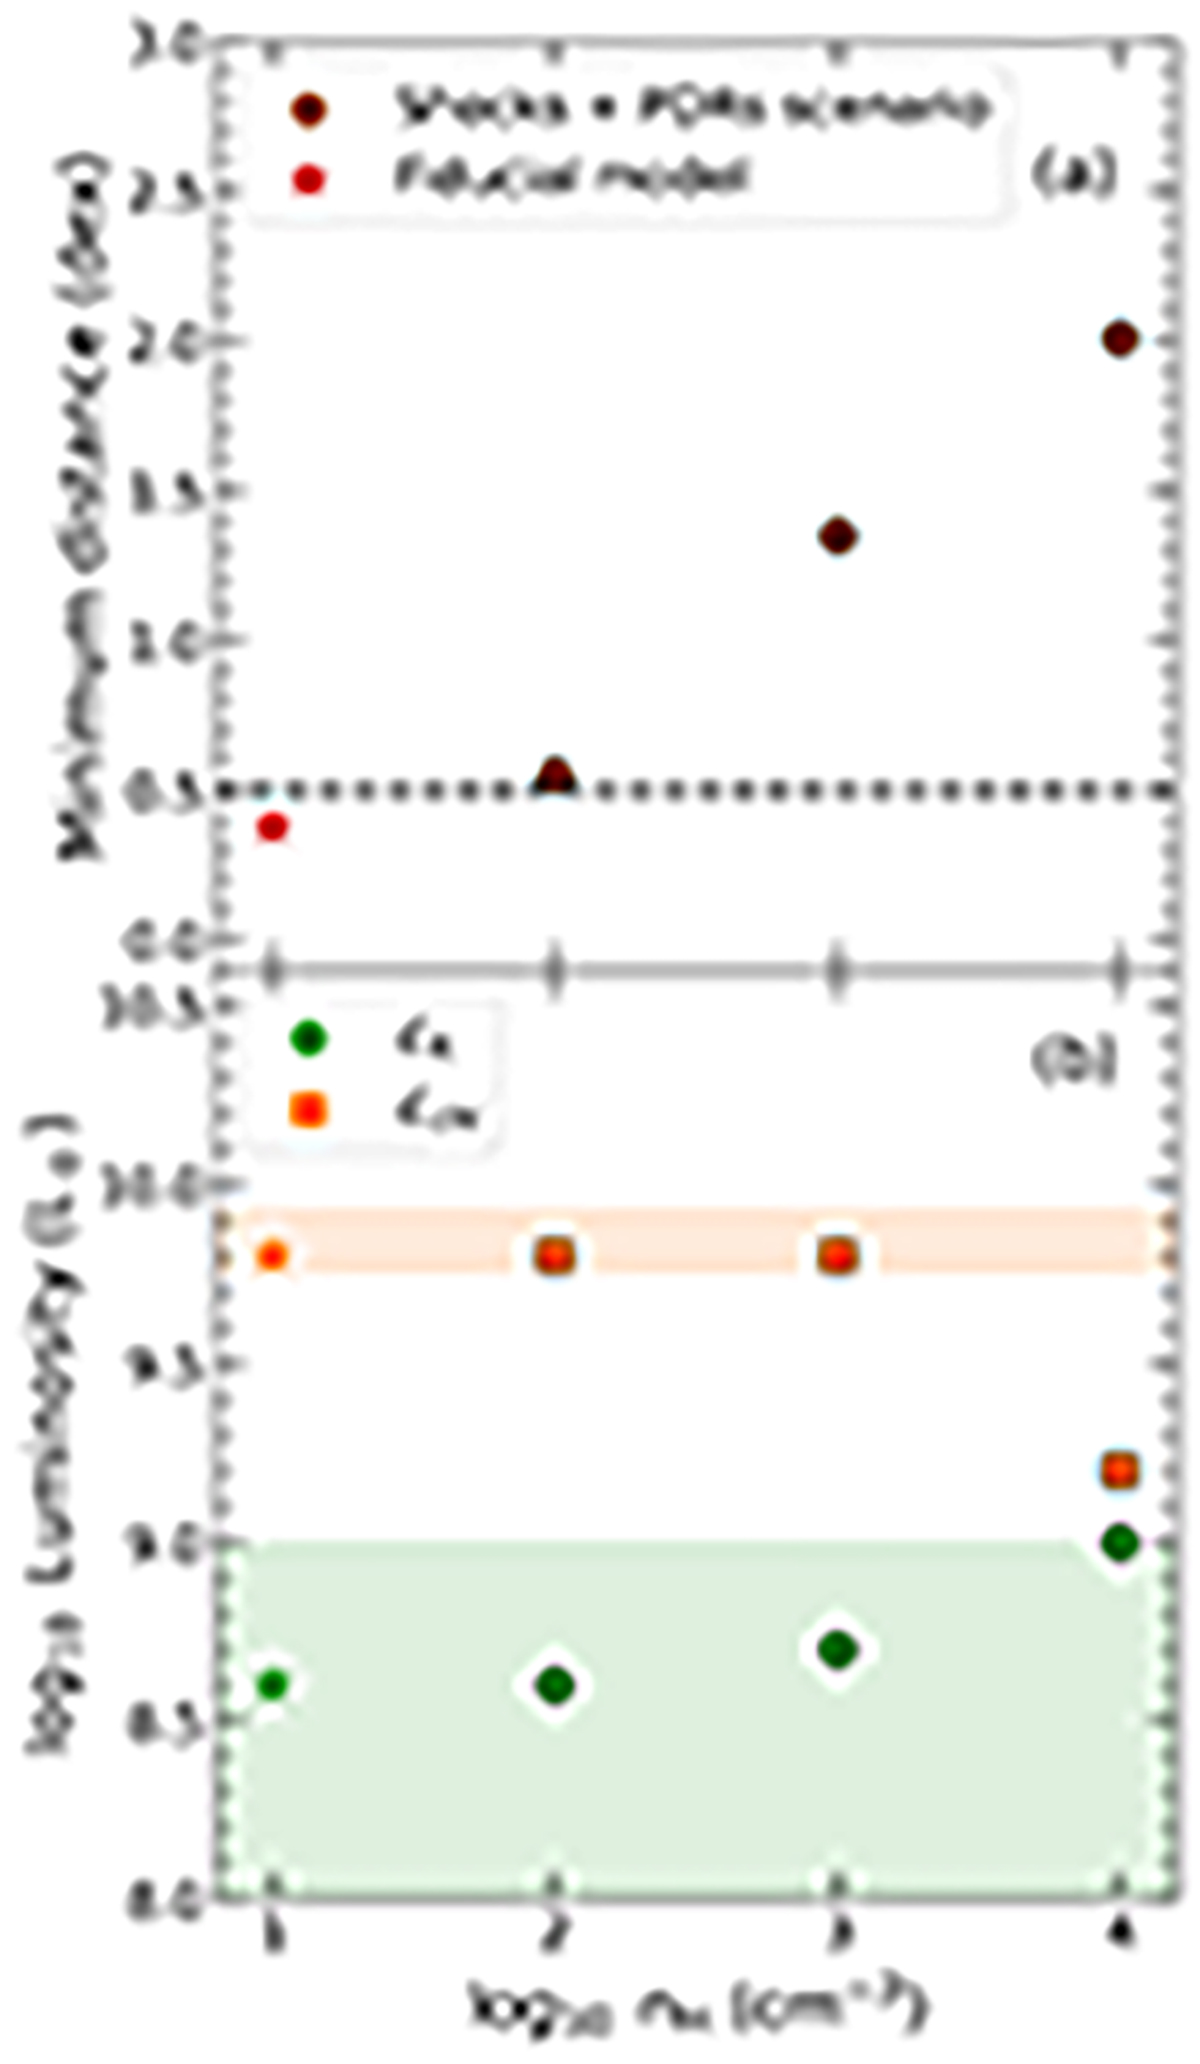
Solution for a combination of shocks and PDRs, assuming an exponential probability distribution function. Panel (a): distance vs. the medium’s density. The dashed line represents a 0.5 dex limit (i.e., a factor of 3 difference between observed and modeled line intensities) to guide the eye. Panel (b): derived mechanical-reprocessed luminosity from Eq. (6) as well as the UV-reprocessed luminosity from Eq. (8) as a function of density are shown in green and orange, respectively. The green area represents < 1% of the estimated jet kinetic luminosity of 3C 326 N, while the orange area represents the SED estimation of the reprocessed UV-luminosity (see Appendix C).
Current usage metrics show cumulative count of Article Views (full-text article views including HTML views, PDF and ePub downloads, according to the available data) and Abstracts Views on Vision4Press platform.
Data correspond to usage on the plateform after 2015. The current usage metrics is available 48-96 hours after online publication and is updated daily on week days.
Initial download of the metrics may take a while.