Fig. D.3.
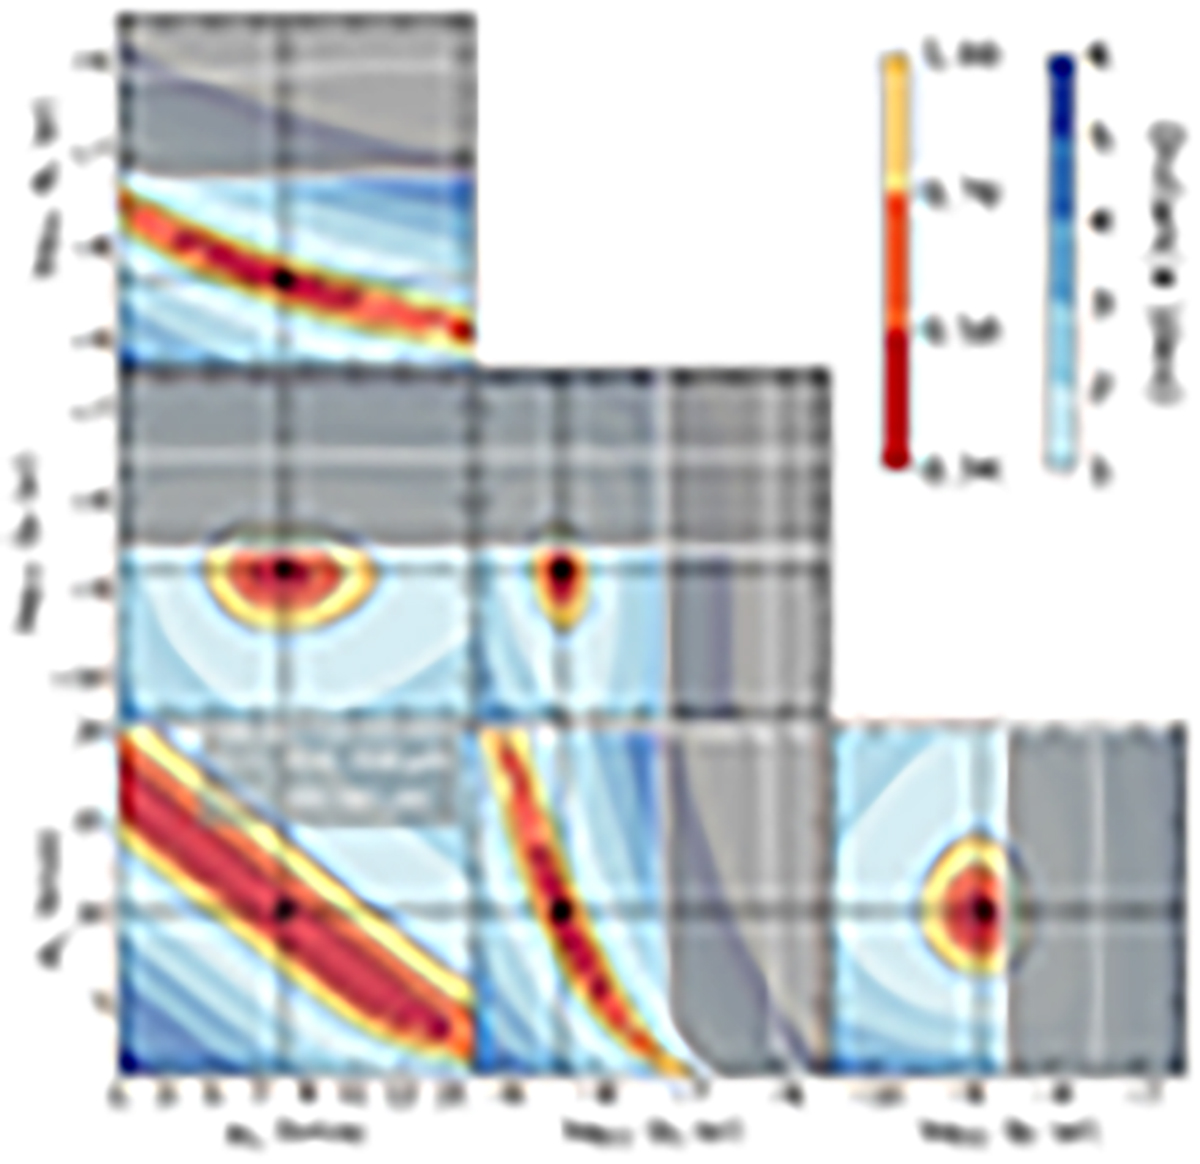
Download original image
2D cutoff of the likelihood distributions of the parameters describing the shock and the PDR distributions obtained for a Gaussian distribution of shock velocities. The parameters are the total shock solid angle ΩS, the central shock velocity μvs and the dispersion of the shock velocities σvs, and the PDR total solid angle ΩP. The color code represents the distance in dex units. The 0.5, 0.7, and 1.0 dex limits are highlighted with dashed black lines. The straight black dashed lines and the black points indicate the position of the global minimum. The gray areas represent the regions where the assumption on the radiative transfer regarding cross-absorption between surfaces breaks down. The criterion is more stringent for the [OI] 63 μm line (gray area above the white solid line) than for the [CII] 158 μm line (gray area above the white dashed line), and is always fulfilled for the H2 lines (see Appendix A).
Current usage metrics show cumulative count of Article Views (full-text article views including HTML views, PDF and ePub downloads, according to the available data) and Abstracts Views on Vision4Press platform.
Data correspond to usage on the plateform after 2015. The current usage metrics is available 48-96 hours after online publication and is updated daily on week days.
Initial download of the metrics may take a while.