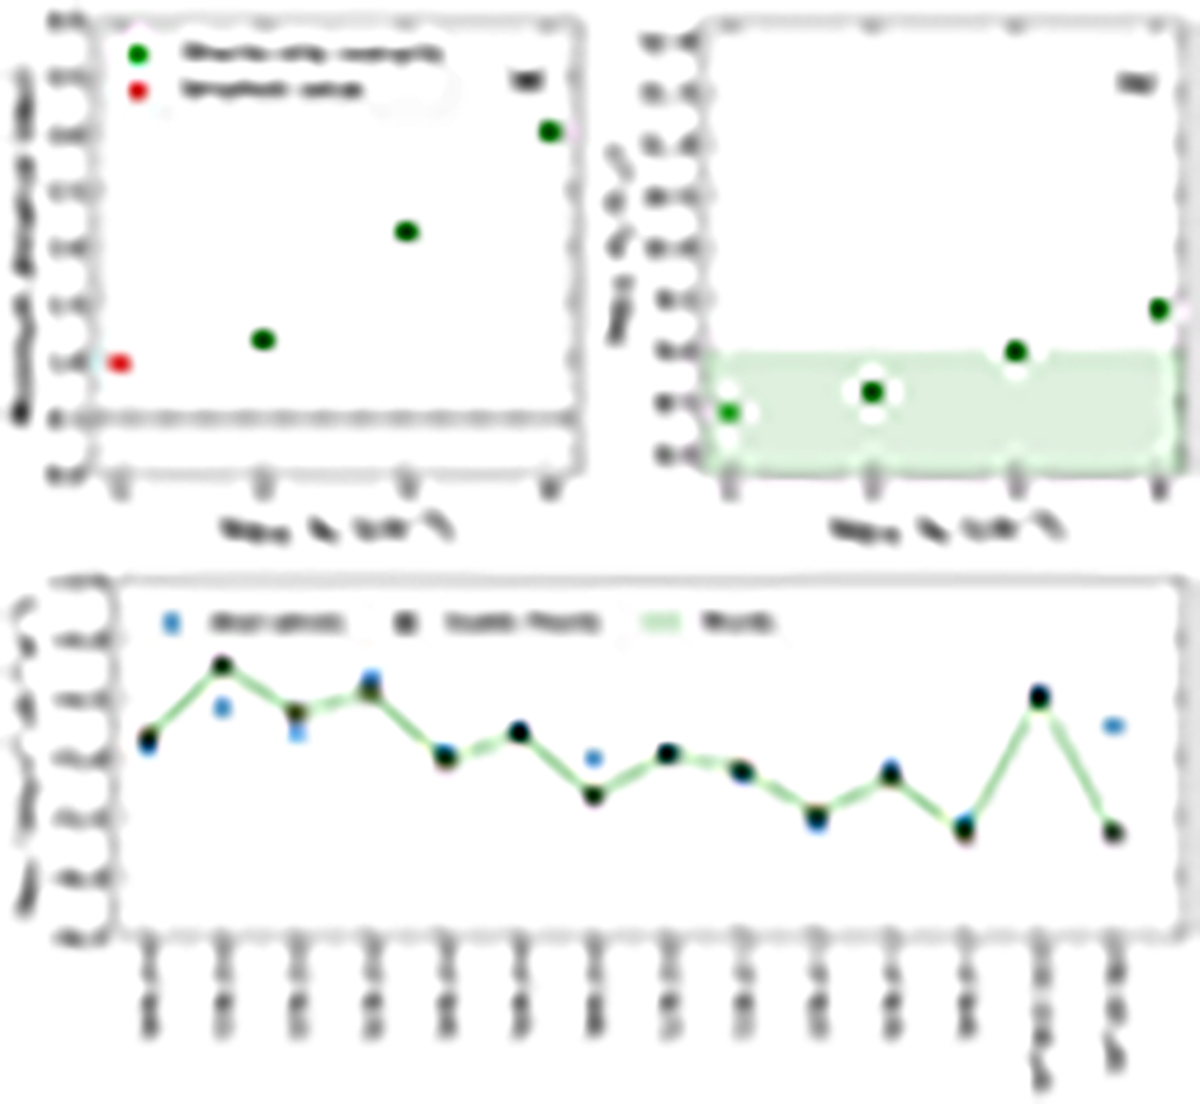
Fig. D.2.
Download original image
Summary of the minimum distance, the mechanical luminosity, and the intensities predicted with a sole distribution of shock models for the shock-only scenario. Panel (a): Minimum distance as a function of the pre-shock density. The dashed line represents a 0.5 dex limit (i.e., a factor of three difference between observed and modeled line intensities) to guide the eye. Panel (b): Mechanical luminosity as a function of the pre-shock density. The green area represents < 1% of the estimated jet kinetic luminosity of 3C 326 N (see Sect. 4.3). Panel (c): Comparison between the observed line intensities and those obtained for the model at nH = 10 cm−3, b = 0.1, G0 = 10. Observations are presented as blue stars (see Table B.2) and modeled intensities are shown as open black circles.
Current usage metrics show cumulative count of Article Views (full-text article views including HTML views, PDF and ePub downloads, according to the available data) and Abstracts Views on Vision4Press platform.
Data correspond to usage on the plateform after 2015. The current usage metrics is available 48-96 hours after online publication and is updated daily on week days.
Initial download of the metrics may take a while.