Fig. D.1.
Download original image
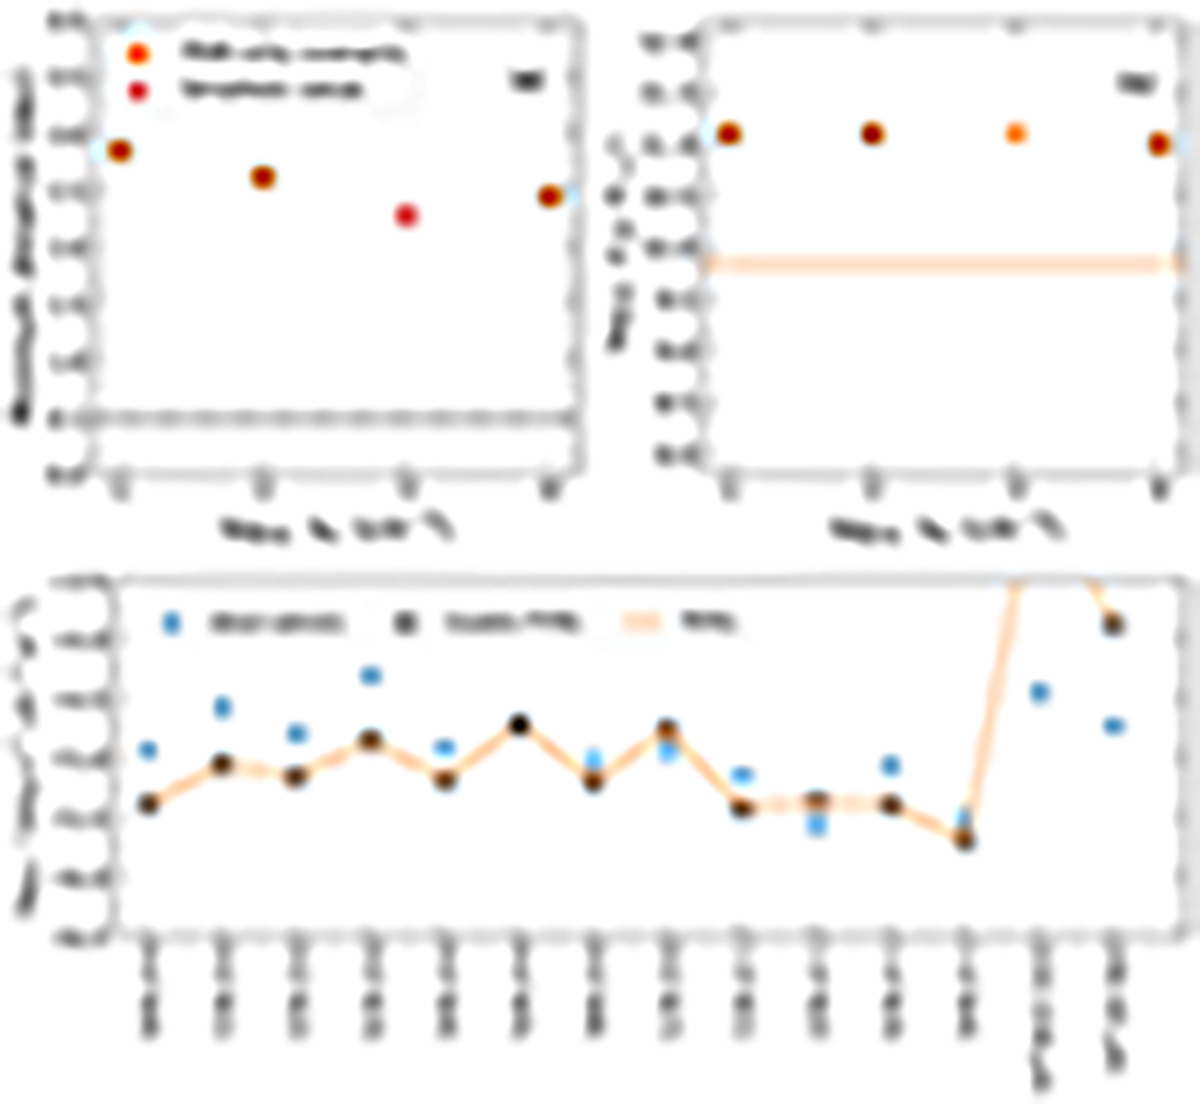
Summary of the minimum distance, the UV-reprocessed luminosity, and the intensities predicted with a sole distribution of PDR models for the PDR-only scenario. Panel (a): Minimum distance as a function of the gas density. The dashed line represents a 0.5 dex limit (i.e., a factor of three difference between observed and modeled line intensities) to guide the eye. Panel (b): UV-reprocessed luminosity as a function of the gas density. The orange shaded area represents the SED estimation of the reprocessed UV-luminosity (see Appendix C). Panel (c): Comparison between the observed line intensities and those obtained for the model at nH = 103 cm−3, b = 0.1, G0 = 10. The observations are presented as blue stars (see Table B.2) and the modeled intensities are shown as open black circles. In the lower panel, the residuals are shown as orange squares. The dashed and solid lines give the ± 0.5, 1 dex limits, respectively.
Current usage metrics show cumulative count of Article Views (full-text article views including HTML views, PDF and ePub downloads, according to the available data) and Abstracts Views on Vision4Press platform.
Data correspond to usage on the plateform after 2015. The current usage metrics is available 48-96 hours after online publication and is updated daily on week days.
Initial download of the metrics may take a while.