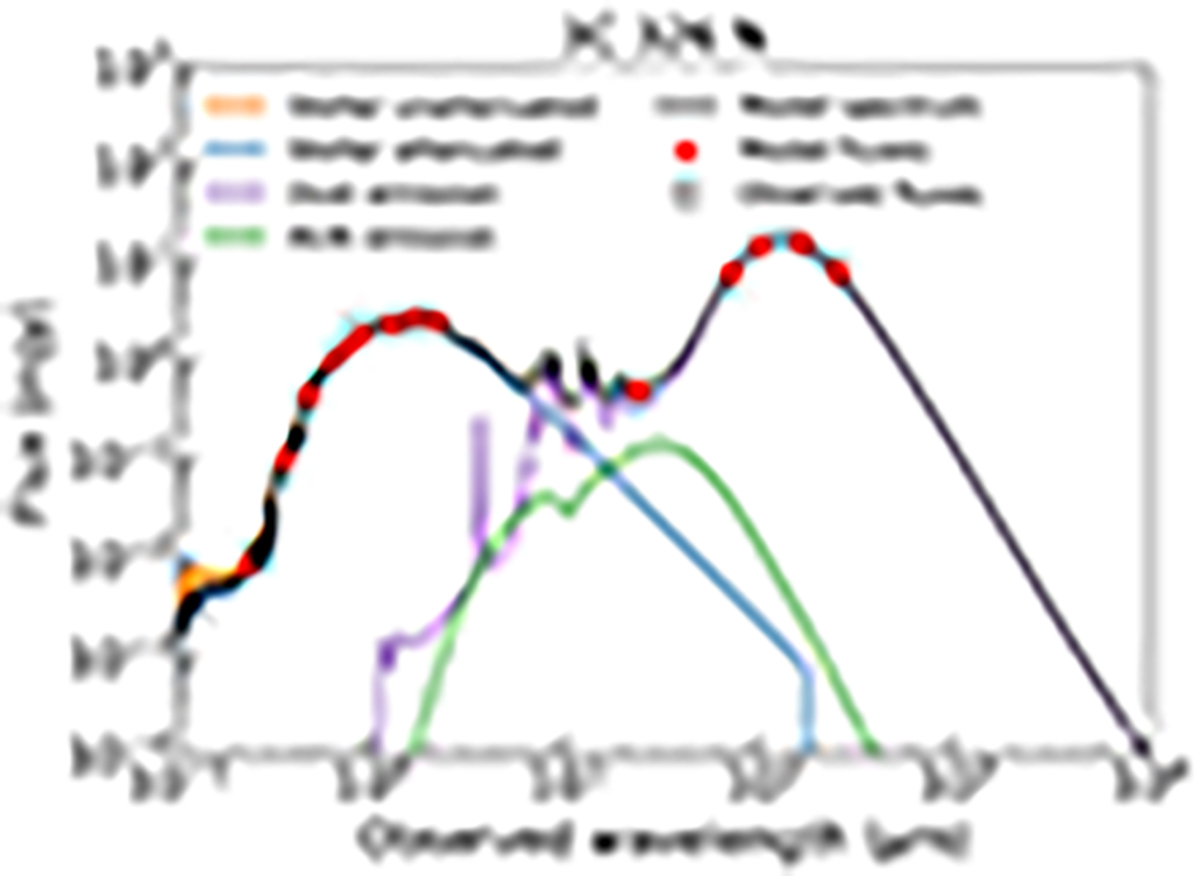
Fig. C.1.
Download original image
Spectral energy distribution of 3C 326 N. The MIR-to-FIR photometry is fitted using CIGALE. The stellar attenuated and unattenuated contributions are shown in blue and orange, respectively. The reprocessed IR emission is presented in purple and the AGN emission is in green. The best model is shown as a solid black line. The observed uncertainties are added in quadrature with a 10% floor value to account for possible instrumental errors.
Current usage metrics show cumulative count of Article Views (full-text article views including HTML views, PDF and ePub downloads, according to the available data) and Abstracts Views on Vision4Press platform.
Data correspond to usage on the plateform after 2015. The current usage metrics is available 48-96 hours after online publication and is updated daily on week days.
Initial download of the metrics may take a while.