Fig. A.2.
Download original image
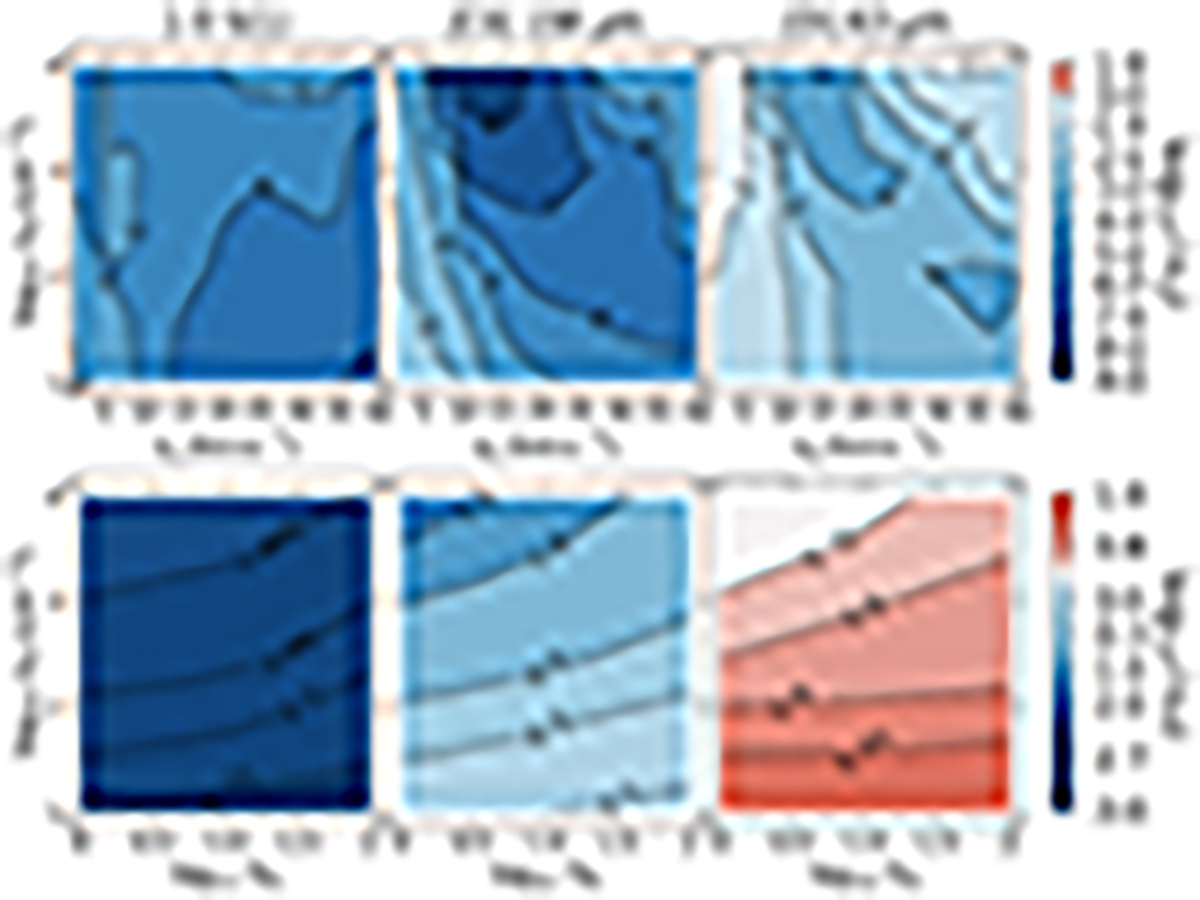
Opacities of the emission lines in shocks as functions of the pre-shock density and the shock velocity (top row) and in PDRs as a function of the gas density and the illumination factor (bottom row). All other parameters are set to their standard values given in Table 1. The left column is associated with the H2 1-0 S(1) line, the middle column with the [CII] 158 μm line, and the right column with [OI] 63 μm line. The color-coding indicates the central opacity of the lines τS(ν0) and τP(ν0), with a different color scale for shocks and PDRs.
Current usage metrics show cumulative count of Article Views (full-text article views including HTML views, PDF and ePub downloads, according to the available data) and Abstracts Views on Vision4Press platform.
Data correspond to usage on the plateform after 2015. The current usage metrics is available 48-96 hours after online publication and is updated daily on week days.
Initial download of the metrics may take a while.