Open Access
Fig. B.2.
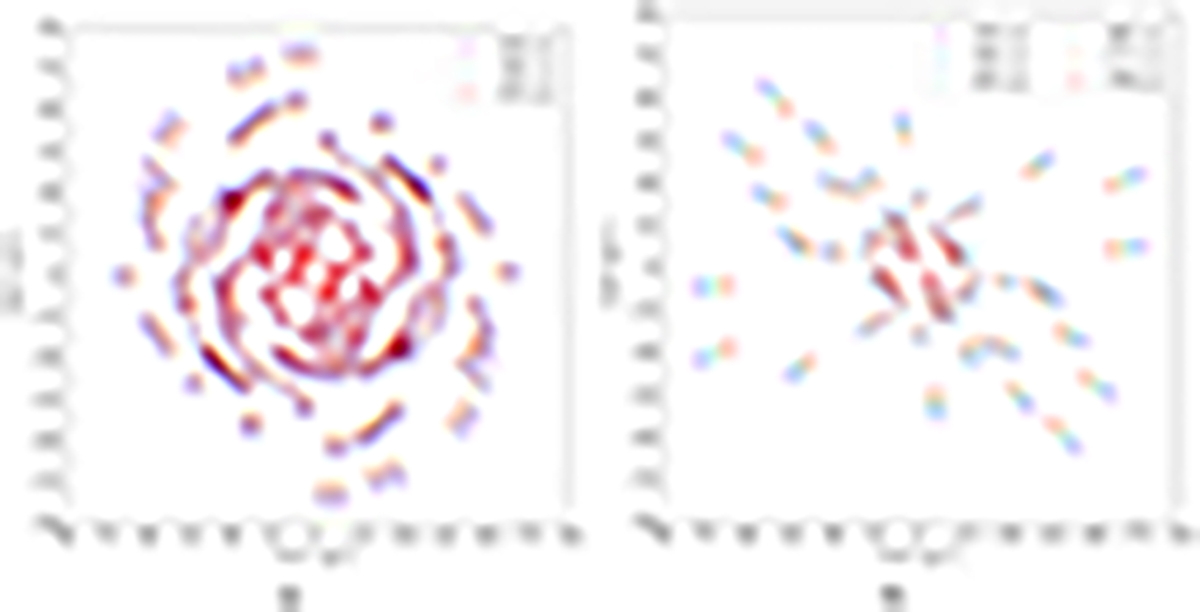
Download original image
PIONIER u-v coverages of the data sets used in this study. The left panel corresponds to the 2014 data set, and the right one corresponds to the 2020 one. The colors in the panels show the different wavelengths covered with the bandpass of the instrument (see the labels in the plot).
Current usage metrics show cumulative count of Article Views (full-text article views including HTML views, PDF and ePub downloads, according to the available data) and Abstracts Views on Vision4Press platform.
Data correspond to usage on the plateform after 2015. The current usage metrics is available 48-96 hours after online publication and is updated daily on week days.
Initial download of the metrics may take a while.