Fig. B.1.
Download original image
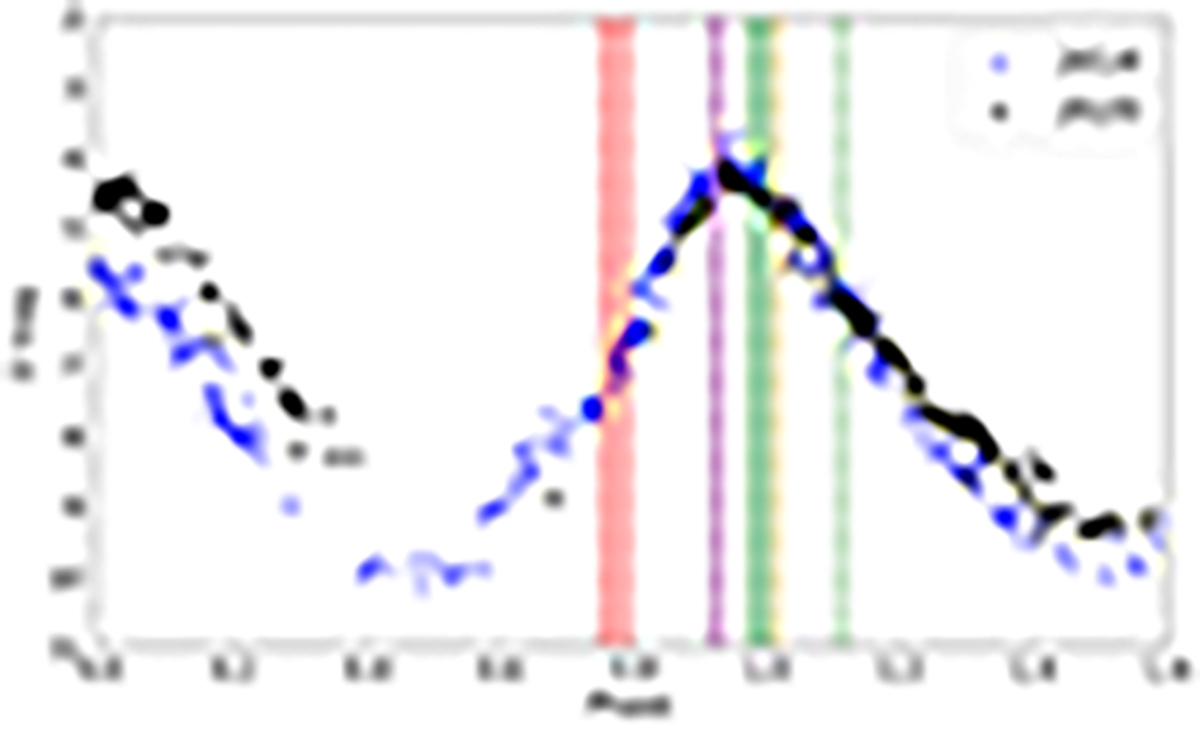
Visual light curves of R Car obtained from the https://www.aavso.org/ database as a function of the pulsation phase around the dates of our interferometric observations. The blue stars and the black circles correspond to the data of the 2014 and 2020 epochs, respectively. The vertical red-shaded area indicates the phase of the 2014 interferometric observations, while the green, orange, and purple areas correspond to the 2020 ones at different station configurations: short, long, and astrometric, respectively (see Tables A.1 and A.2).
Current usage metrics show cumulative count of Article Views (full-text article views including HTML views, PDF and ePub downloads, according to the available data) and Abstracts Views on Vision4Press platform.
Data correspond to usage on the plateform after 2015. The current usage metrics is available 48-96 hours after online publication and is updated daily on week days.
Initial download of the metrics may take a while.