Fig. 2.
Download original image
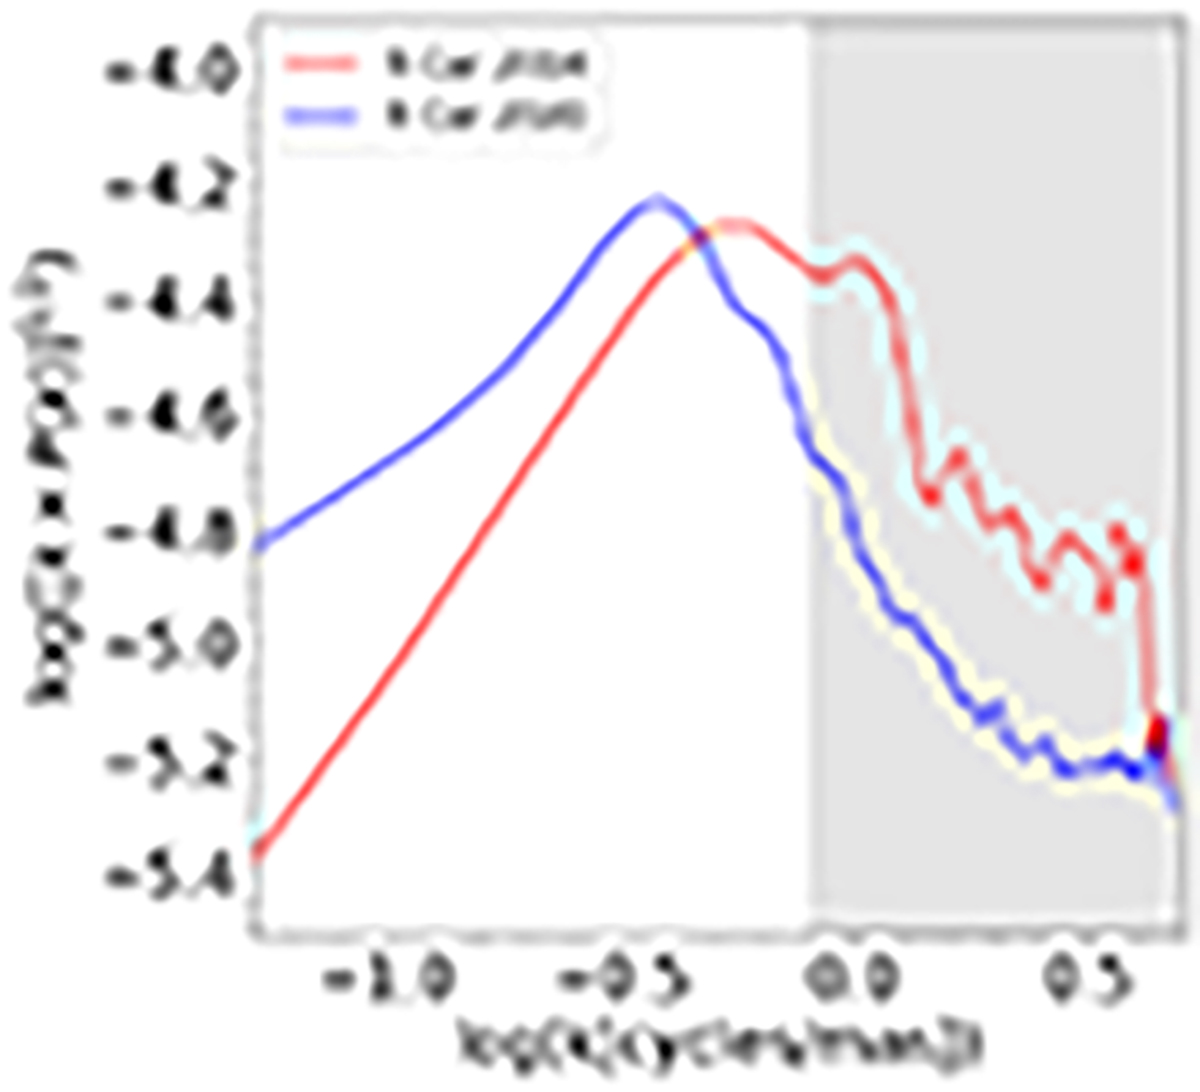
Radial averaged power spectra of the reconstructed images. The red and blue lines show the logarithm of the radial averaged power spectrum versus the logarithm of the spatial frequencies (in cycles mas−1) of the 2014 and 2020 data, respectively. The gray shaded area corresponds to spatial frequencies higher than the best resolution element of the interferometer.
Current usage metrics show cumulative count of Article Views (full-text article views including HTML views, PDF and ePub downloads, according to the available data) and Abstracts Views on Vision4Press platform.
Data correspond to usage on the plateform after 2015. The current usage metrics is available 48-96 hours after online publication and is updated daily on week days.
Initial download of the metrics may take a while.