Open Access
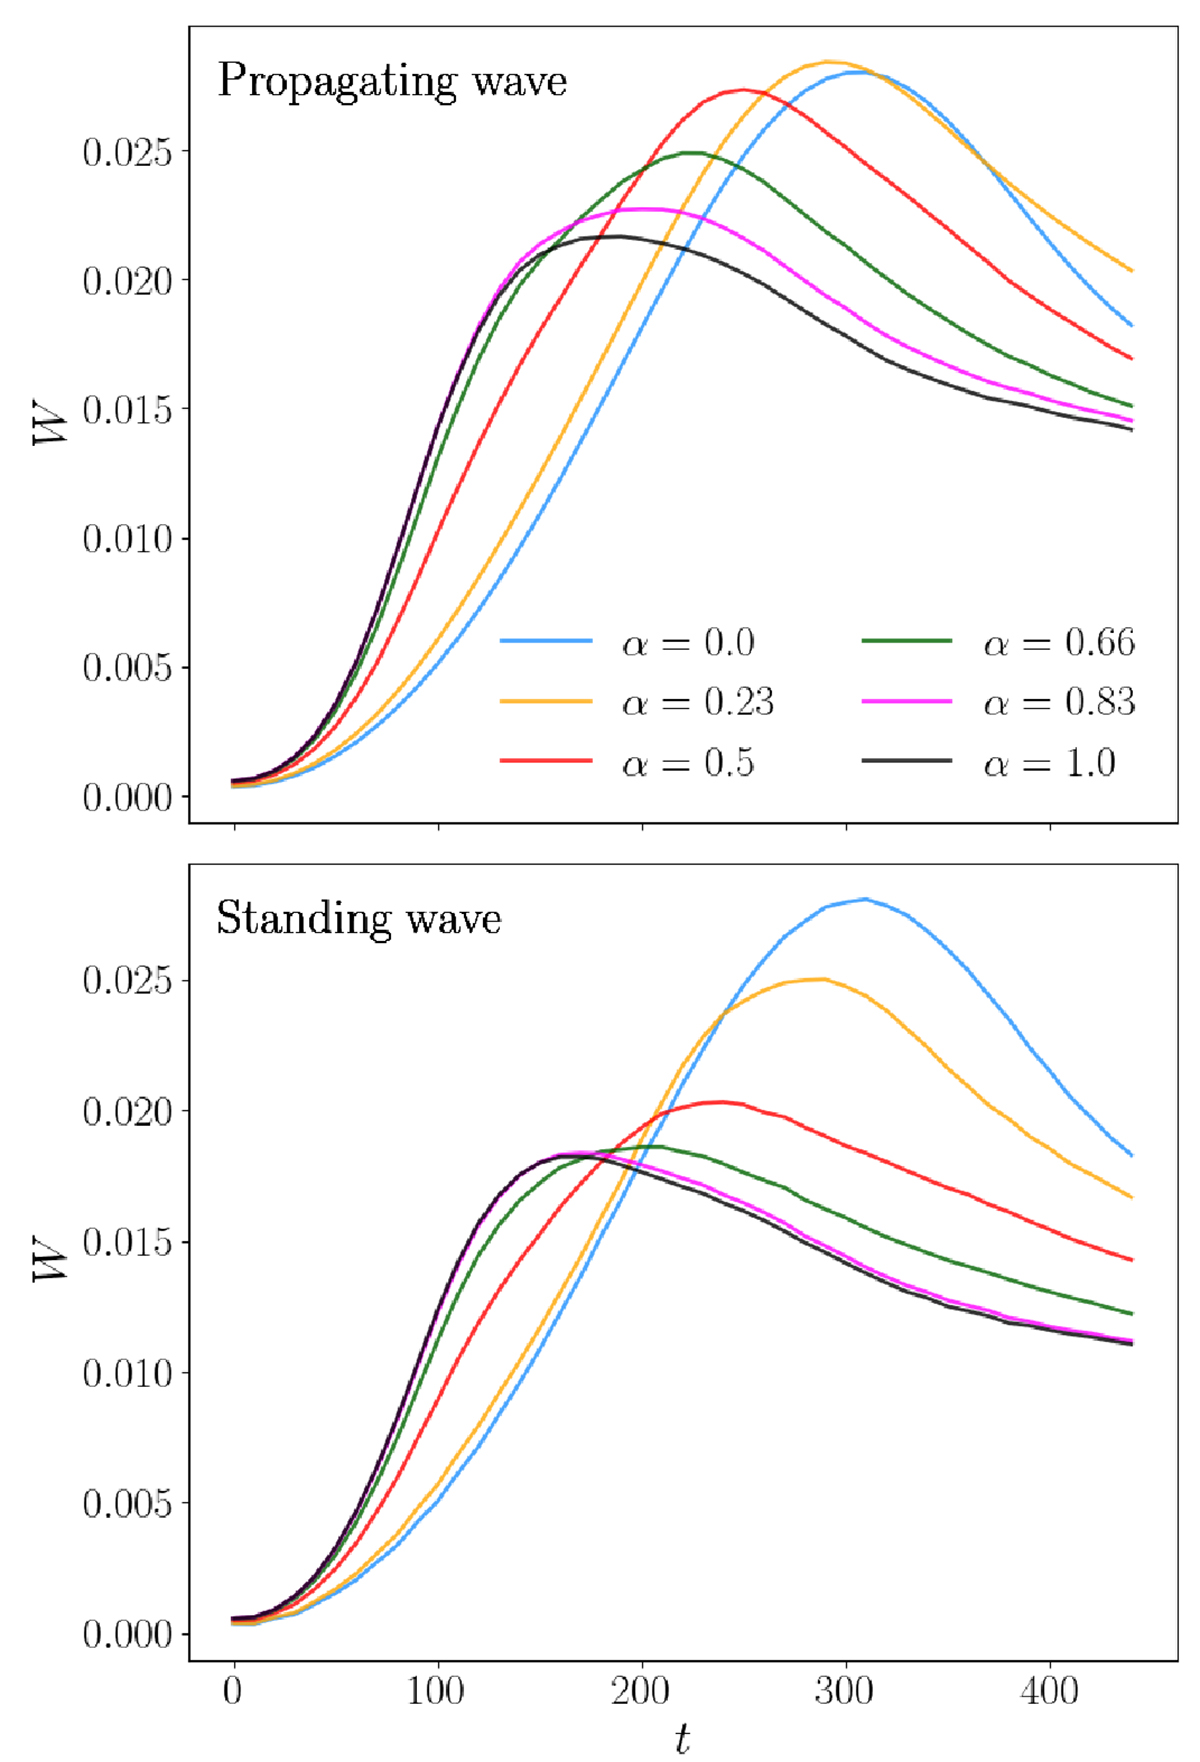
Fig. 8.
Download original image
Time history of W for the case of a single Alfvén wave (top panel for Runs 15–20) and two Alfvén waves (bottom panel for Runs 21–26), and different values of α. The dissipative time decreases for increasing α.
Current usage metrics show cumulative count of Article Views (full-text article views including HTML views, PDF and ePub downloads, according to the available data) and Abstracts Views on Vision4Press platform.
Data correspond to usage on the plateform after 2015. The current usage metrics is available 48-96 hours after online publication and is updated daily on week days.
Initial download of the metrics may take a while.