Fig. 15.
Download original image
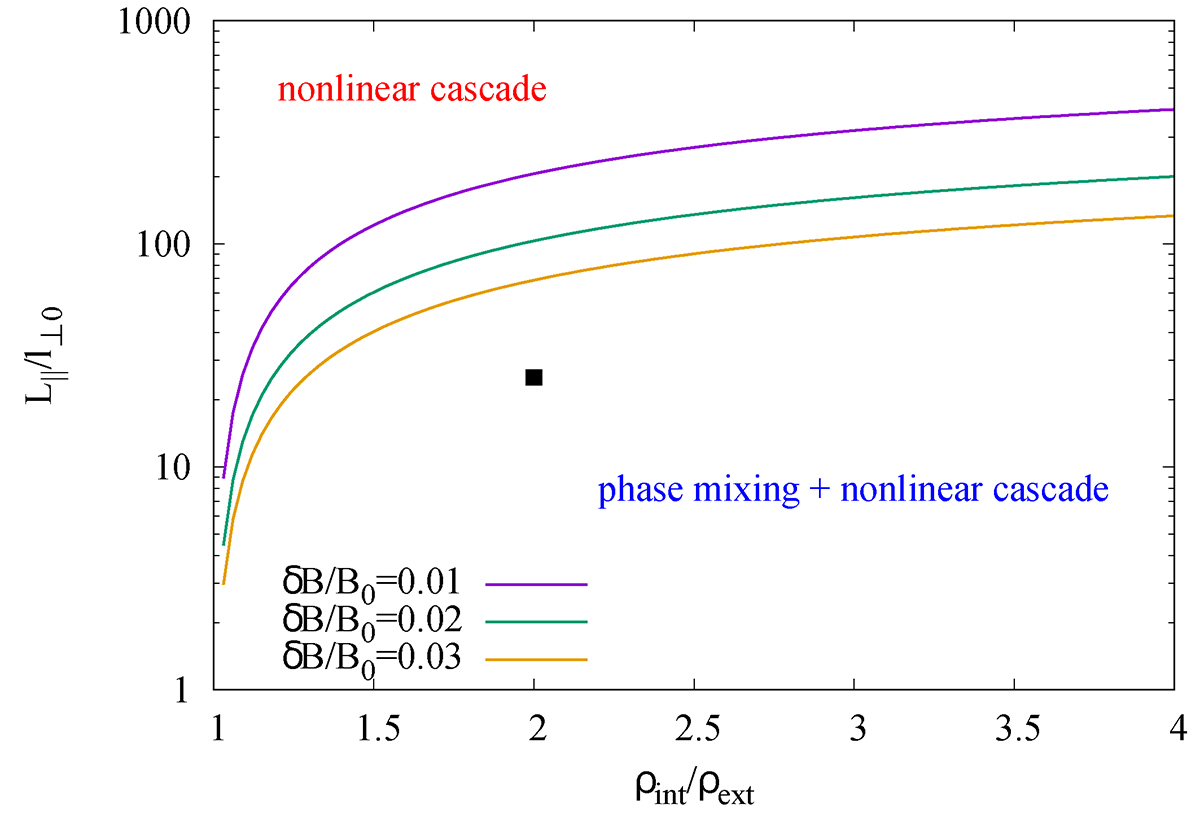
Curves F(ρint/ρext, L||/ℓ⊥0, δB/B0, l⊥0/Δr) = 0 are represented in the (ρint/ρext, L||/ℓ⊥0)-plane, for δB/B0 = 0.01 (purple line), δB/B0 = 0.02 (green line), and δB/B0 = 0.03 (orange line); each curve is calculated for ℓ⊥0/Δr = 1. The portion of the plane below a given curve corresponds to the regime defined by condition (7) (phase mixing + nonlinear cascade regime), while the portion above the curve corresponds to the opposite condition (nonlinear cascade regime). The black dot indicates the configuration considered in Run 20.
Current usage metrics show cumulative count of Article Views (full-text article views including HTML views, PDF and ePub downloads, according to the available data) and Abstracts Views on Vision4Press platform.
Data correspond to usage on the plateform after 2015. The current usage metrics is available 48-96 hours after online publication and is updated daily on week days.
Initial download of the metrics may take a while.