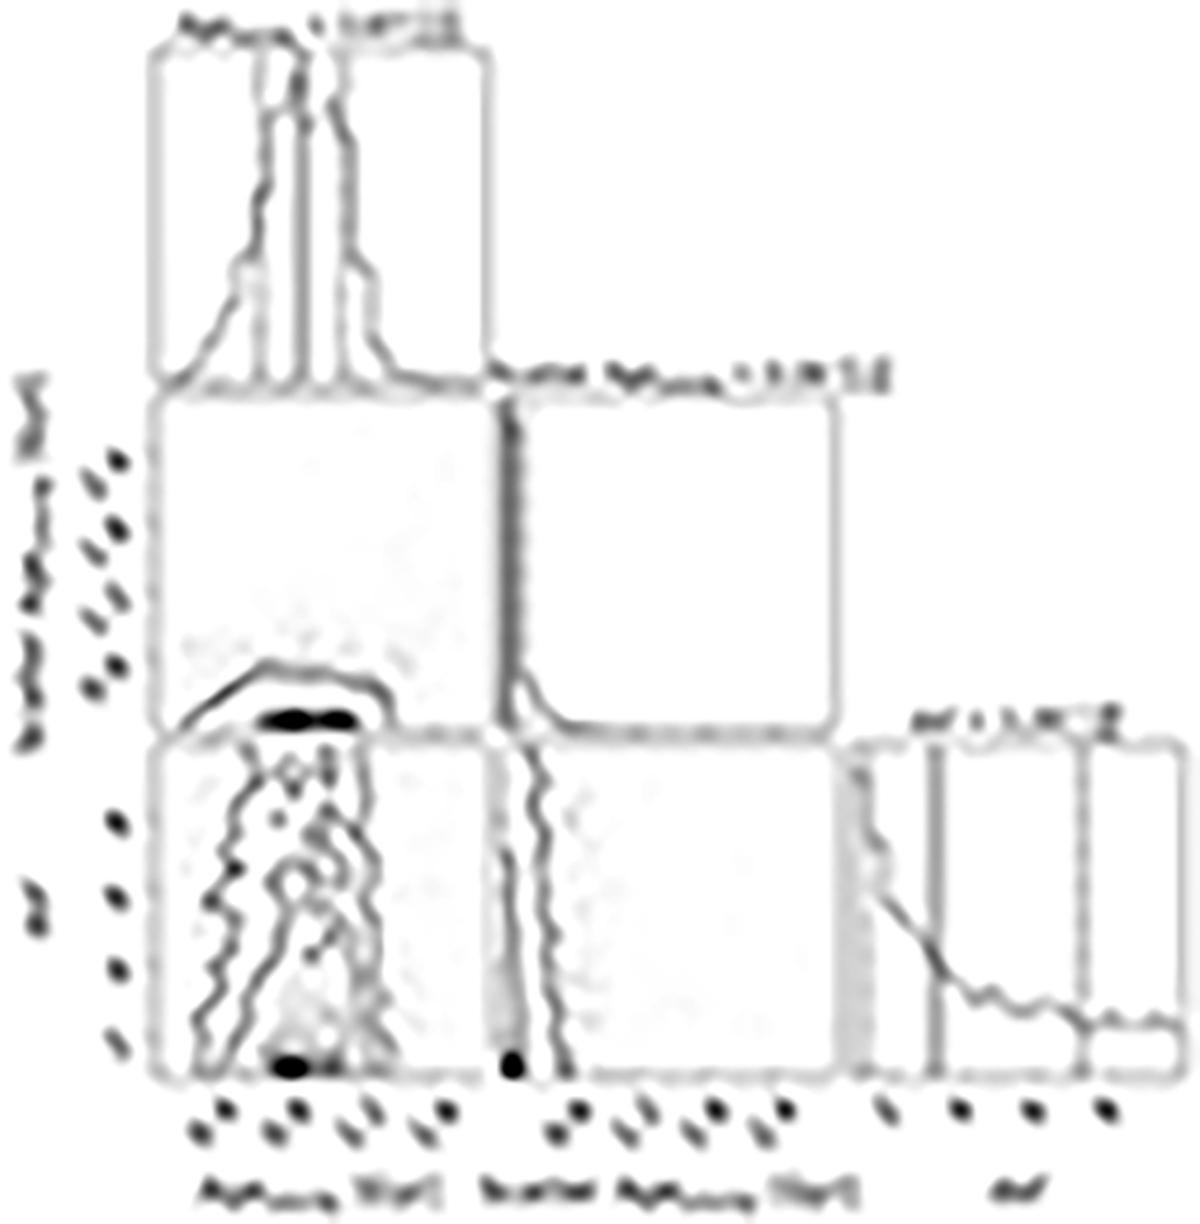
Fig. 5.
Download original image
Corner plot summary of the posterior distributions of the Ageyoung, its scatter, and the degrees of freedom of the Student-t distribution obtained for the four subregions of the inner ring of the Cartwheel galaxy. The panels on the diagonal show the 1D histogram for each model parameter obtained by marginalising over the other parameters, with median and 16%–84% intervals indicated by solid and dashed lines, respectively. The off-diagonal panels show 2D projections of the posterior probability with contours at the 68% and 95% levels.
Current usage metrics show cumulative count of Article Views (full-text article views including HTML views, PDF and ePub downloads, according to the available data) and Abstracts Views on Vision4Press platform.
Data correspond to usage on the plateform after 2015. The current usage metrics is available 48-96 hours after online publication and is updated daily on week days.
Initial download of the metrics may take a while.