Fig. 4.
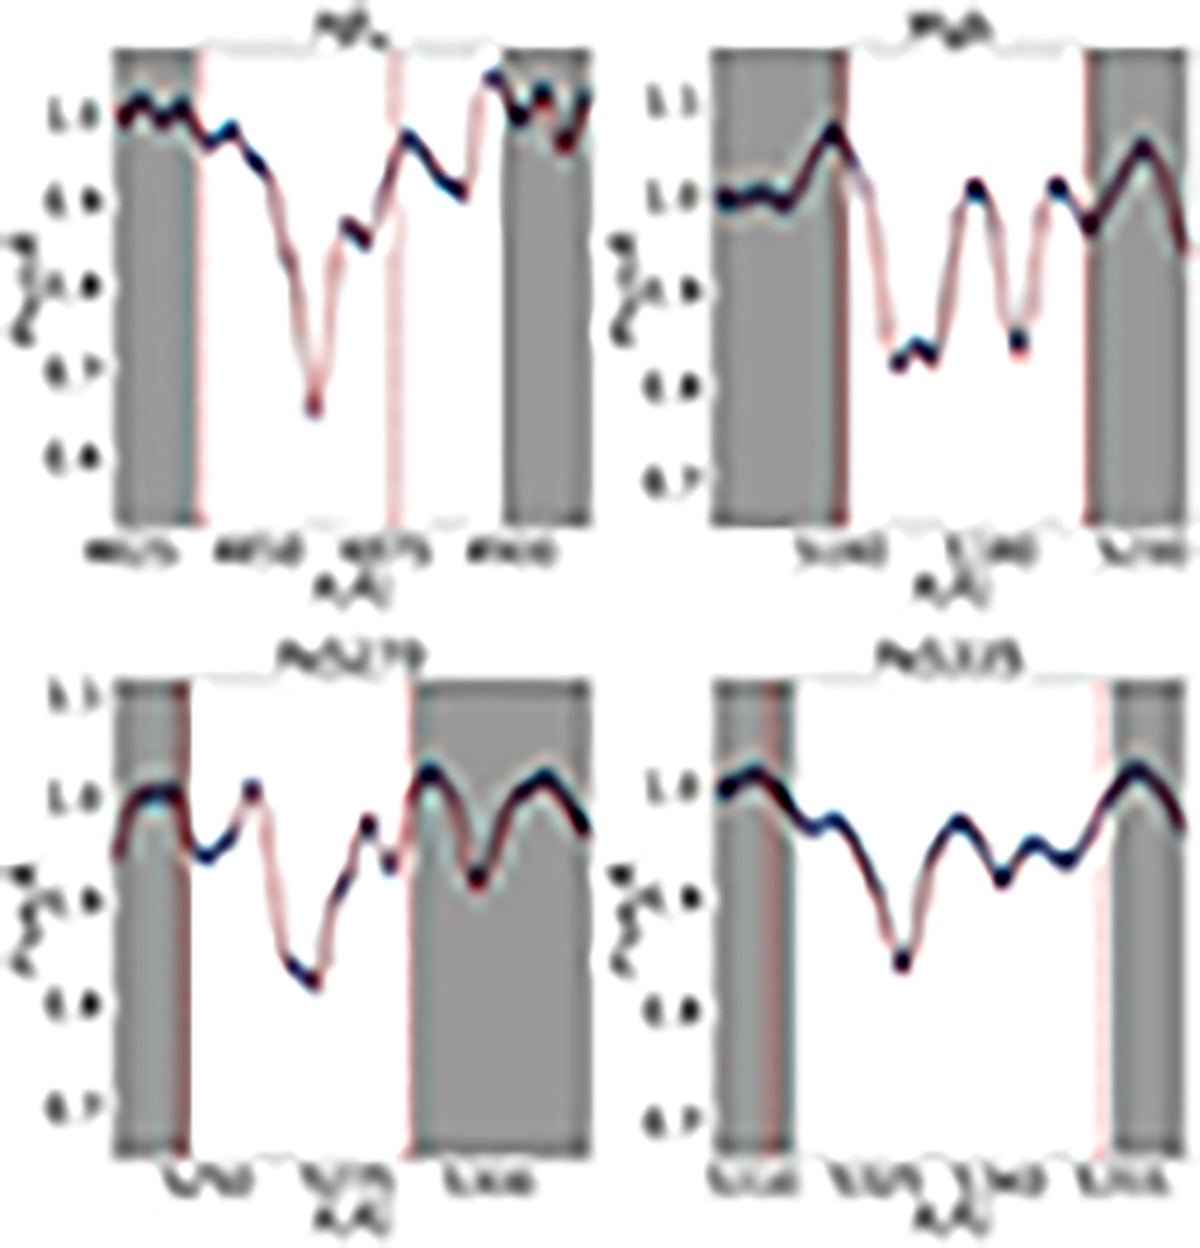
Download original image
FIF application on the four spectral indices of the inner ring spectrum used. The vertical dashed brown lines mark the central feature of each index. The spectral features are normalised using the index pseudo-continua (grey shaded regions). The black lines and the blue shaded regions represent the observed spectrum and the relative uncertainties, respectively, while the superimposed red dashed lines are the best-fit obtained from the posterior distribution.
Current usage metrics show cumulative count of Article Views (full-text article views including HTML views, PDF and ePub downloads, according to the available data) and Abstracts Views on Vision4Press platform.
Data correspond to usage on the plateform after 2015. The current usage metrics is available 48-96 hours after online publication and is updated daily on week days.
Initial download of the metrics may take a while.