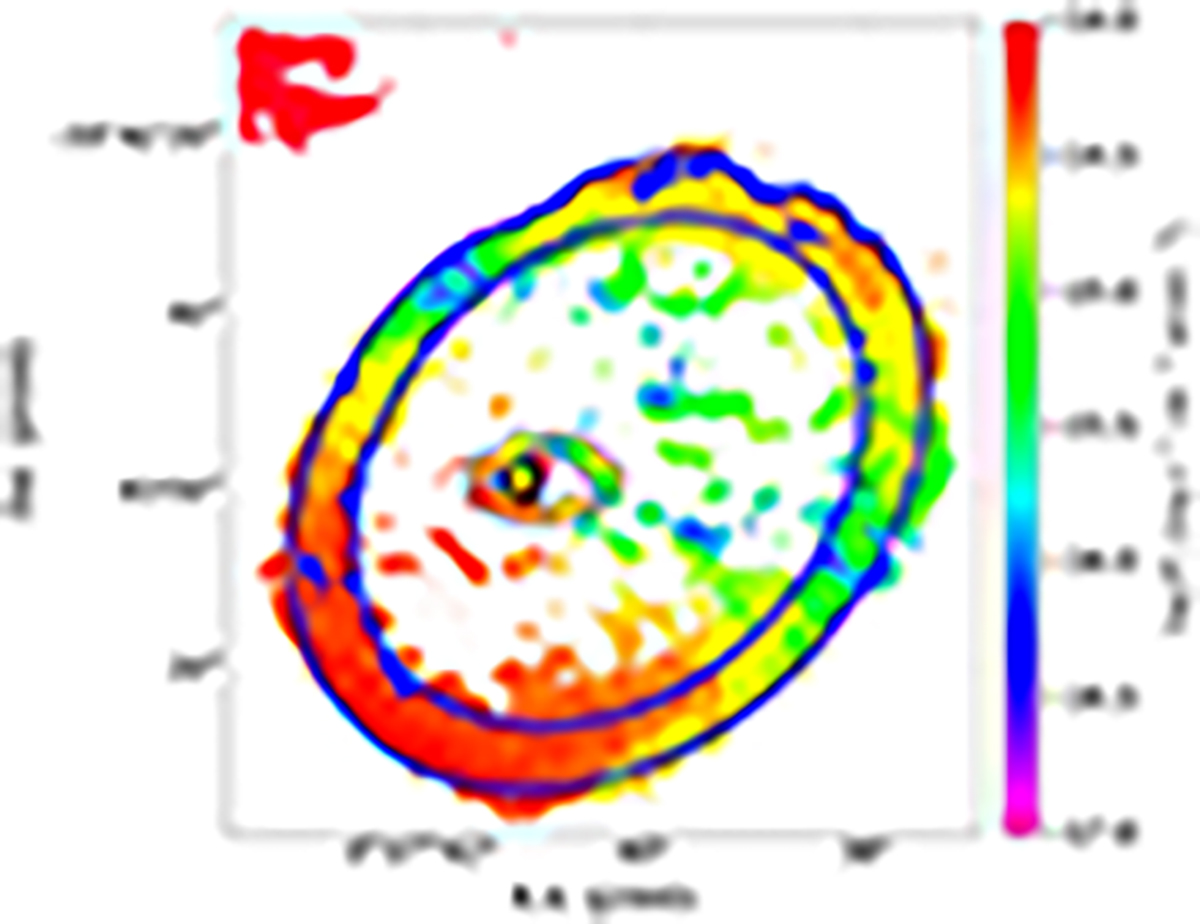
Fig. 2.
Download original image
MUSE Hα map of the Cartwheel galaxy, where the coloured pixels correspond to S/N(Hα) > 5 and with kinematic uncertainties on the strongest line lower than 50 km s−1. The black, grey, and blue contours indicates the ‘nucleus’, ‘inner ring’ and ‘outer ring’ regions, respectively. The ‘in-between’ region is defined by the outer grey contour and the inner blue contour.
Current usage metrics show cumulative count of Article Views (full-text article views including HTML views, PDF and ePub downloads, according to the available data) and Abstracts Views on Vision4Press platform.
Data correspond to usage on the plateform after 2015. The current usage metrics is available 48-96 hours after online publication and is updated daily on week days.
Initial download of the metrics may take a while.