Fig. 6
Download original image
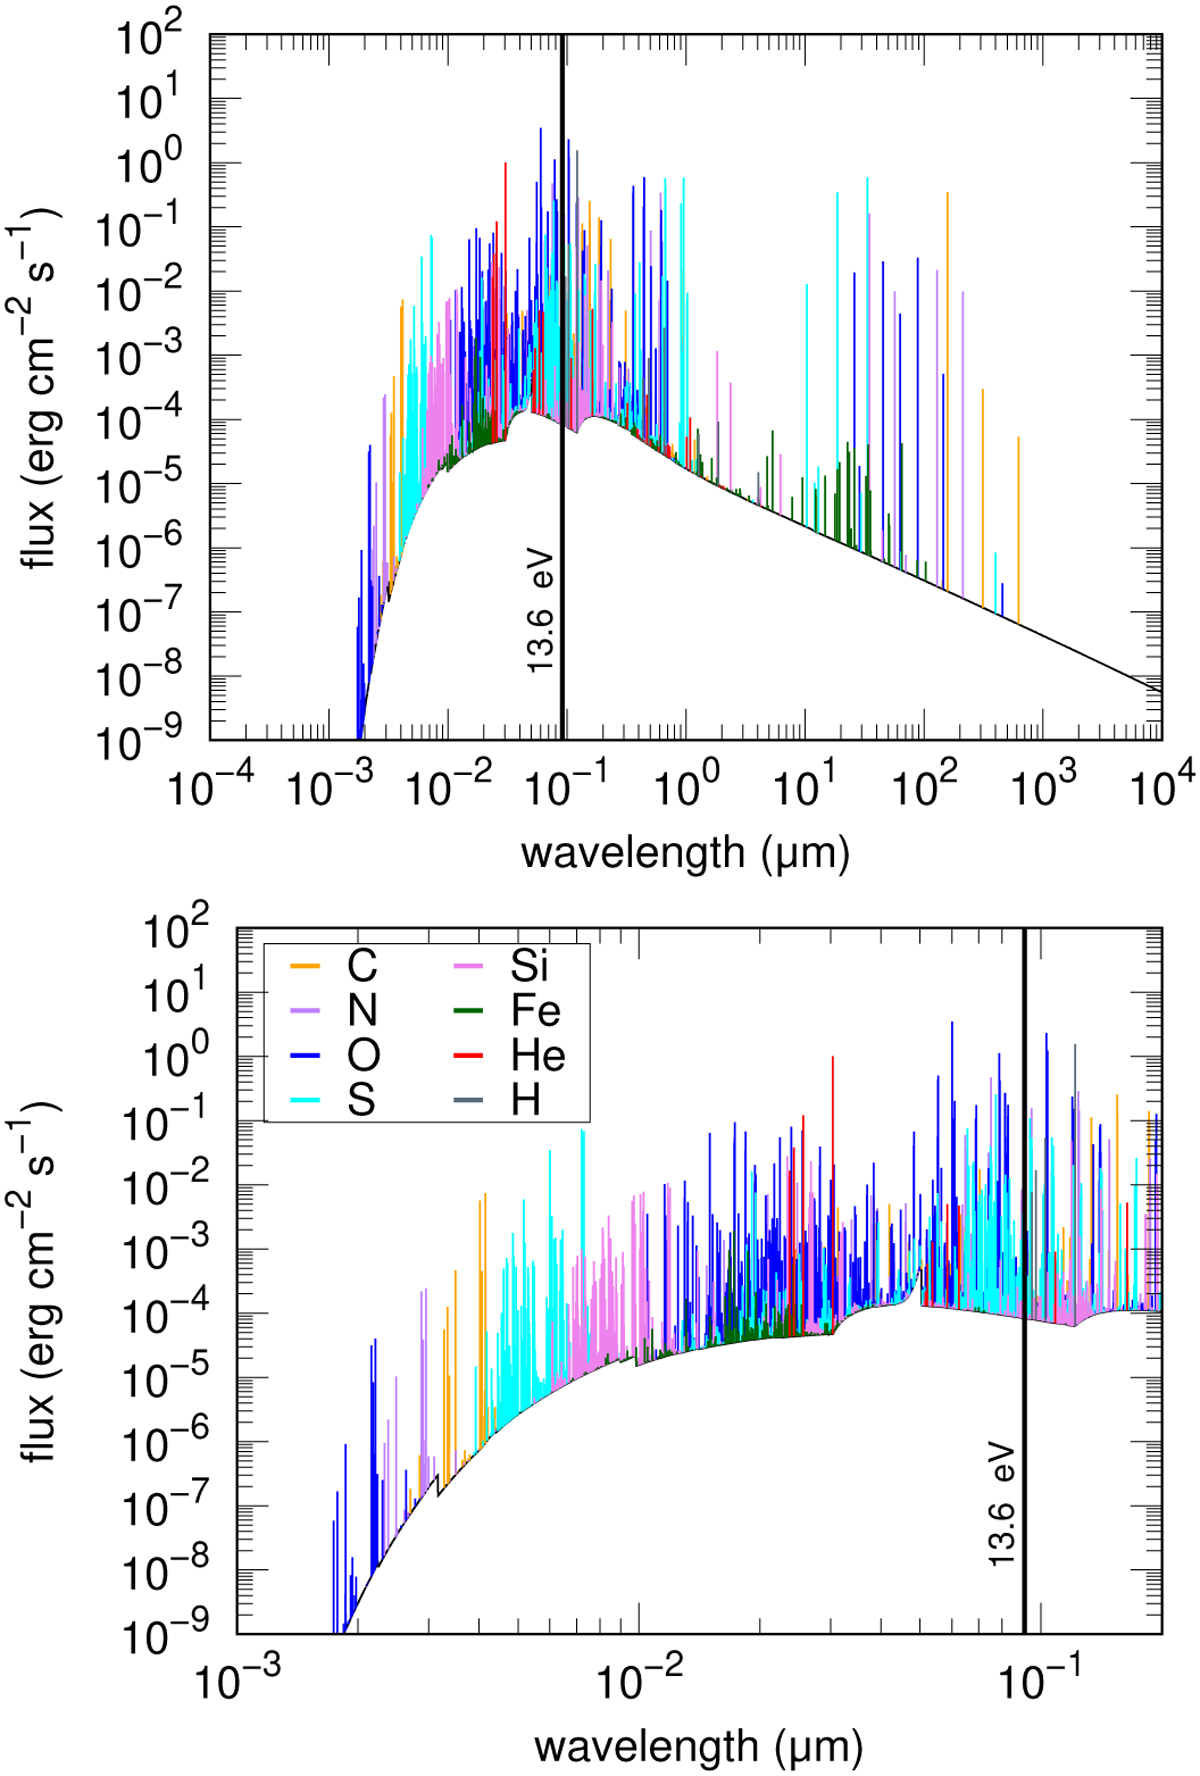
Energy flux, computed as ![]() , emitted toward the preshock at z = 0 in the standard model as a function of the wavelength of the emitted photon. The black curve corresponds to the total continuum emission (including Bremsstrahlung, bound-free, and two-photon processes) and the colored spikes to line emissions. Spikes are colored according to the element responsible for the line emission regardless of its ionization state. The top panel displays the full wavelength range while the bottom panel is a zoom onto the range between 10 and 2000 Å. The black vertical line indicates the ionization threshold of hydrogen.
, emitted toward the preshock at z = 0 in the standard model as a function of the wavelength of the emitted photon. The black curve corresponds to the total continuum emission (including Bremsstrahlung, bound-free, and two-photon processes) and the colored spikes to line emissions. Spikes are colored according to the element responsible for the line emission regardless of its ionization state. The top panel displays the full wavelength range while the bottom panel is a zoom onto the range between 10 and 2000 Å. The black vertical line indicates the ionization threshold of hydrogen.
Current usage metrics show cumulative count of Article Views (full-text article views including HTML views, PDF and ePub downloads, according to the available data) and Abstracts Views on Vision4Press platform.
Data correspond to usage on the plateform after 2015. The current usage metrics is available 48-96 hours after online publication and is updated daily on week days.
Initial download of the metrics may take a while.